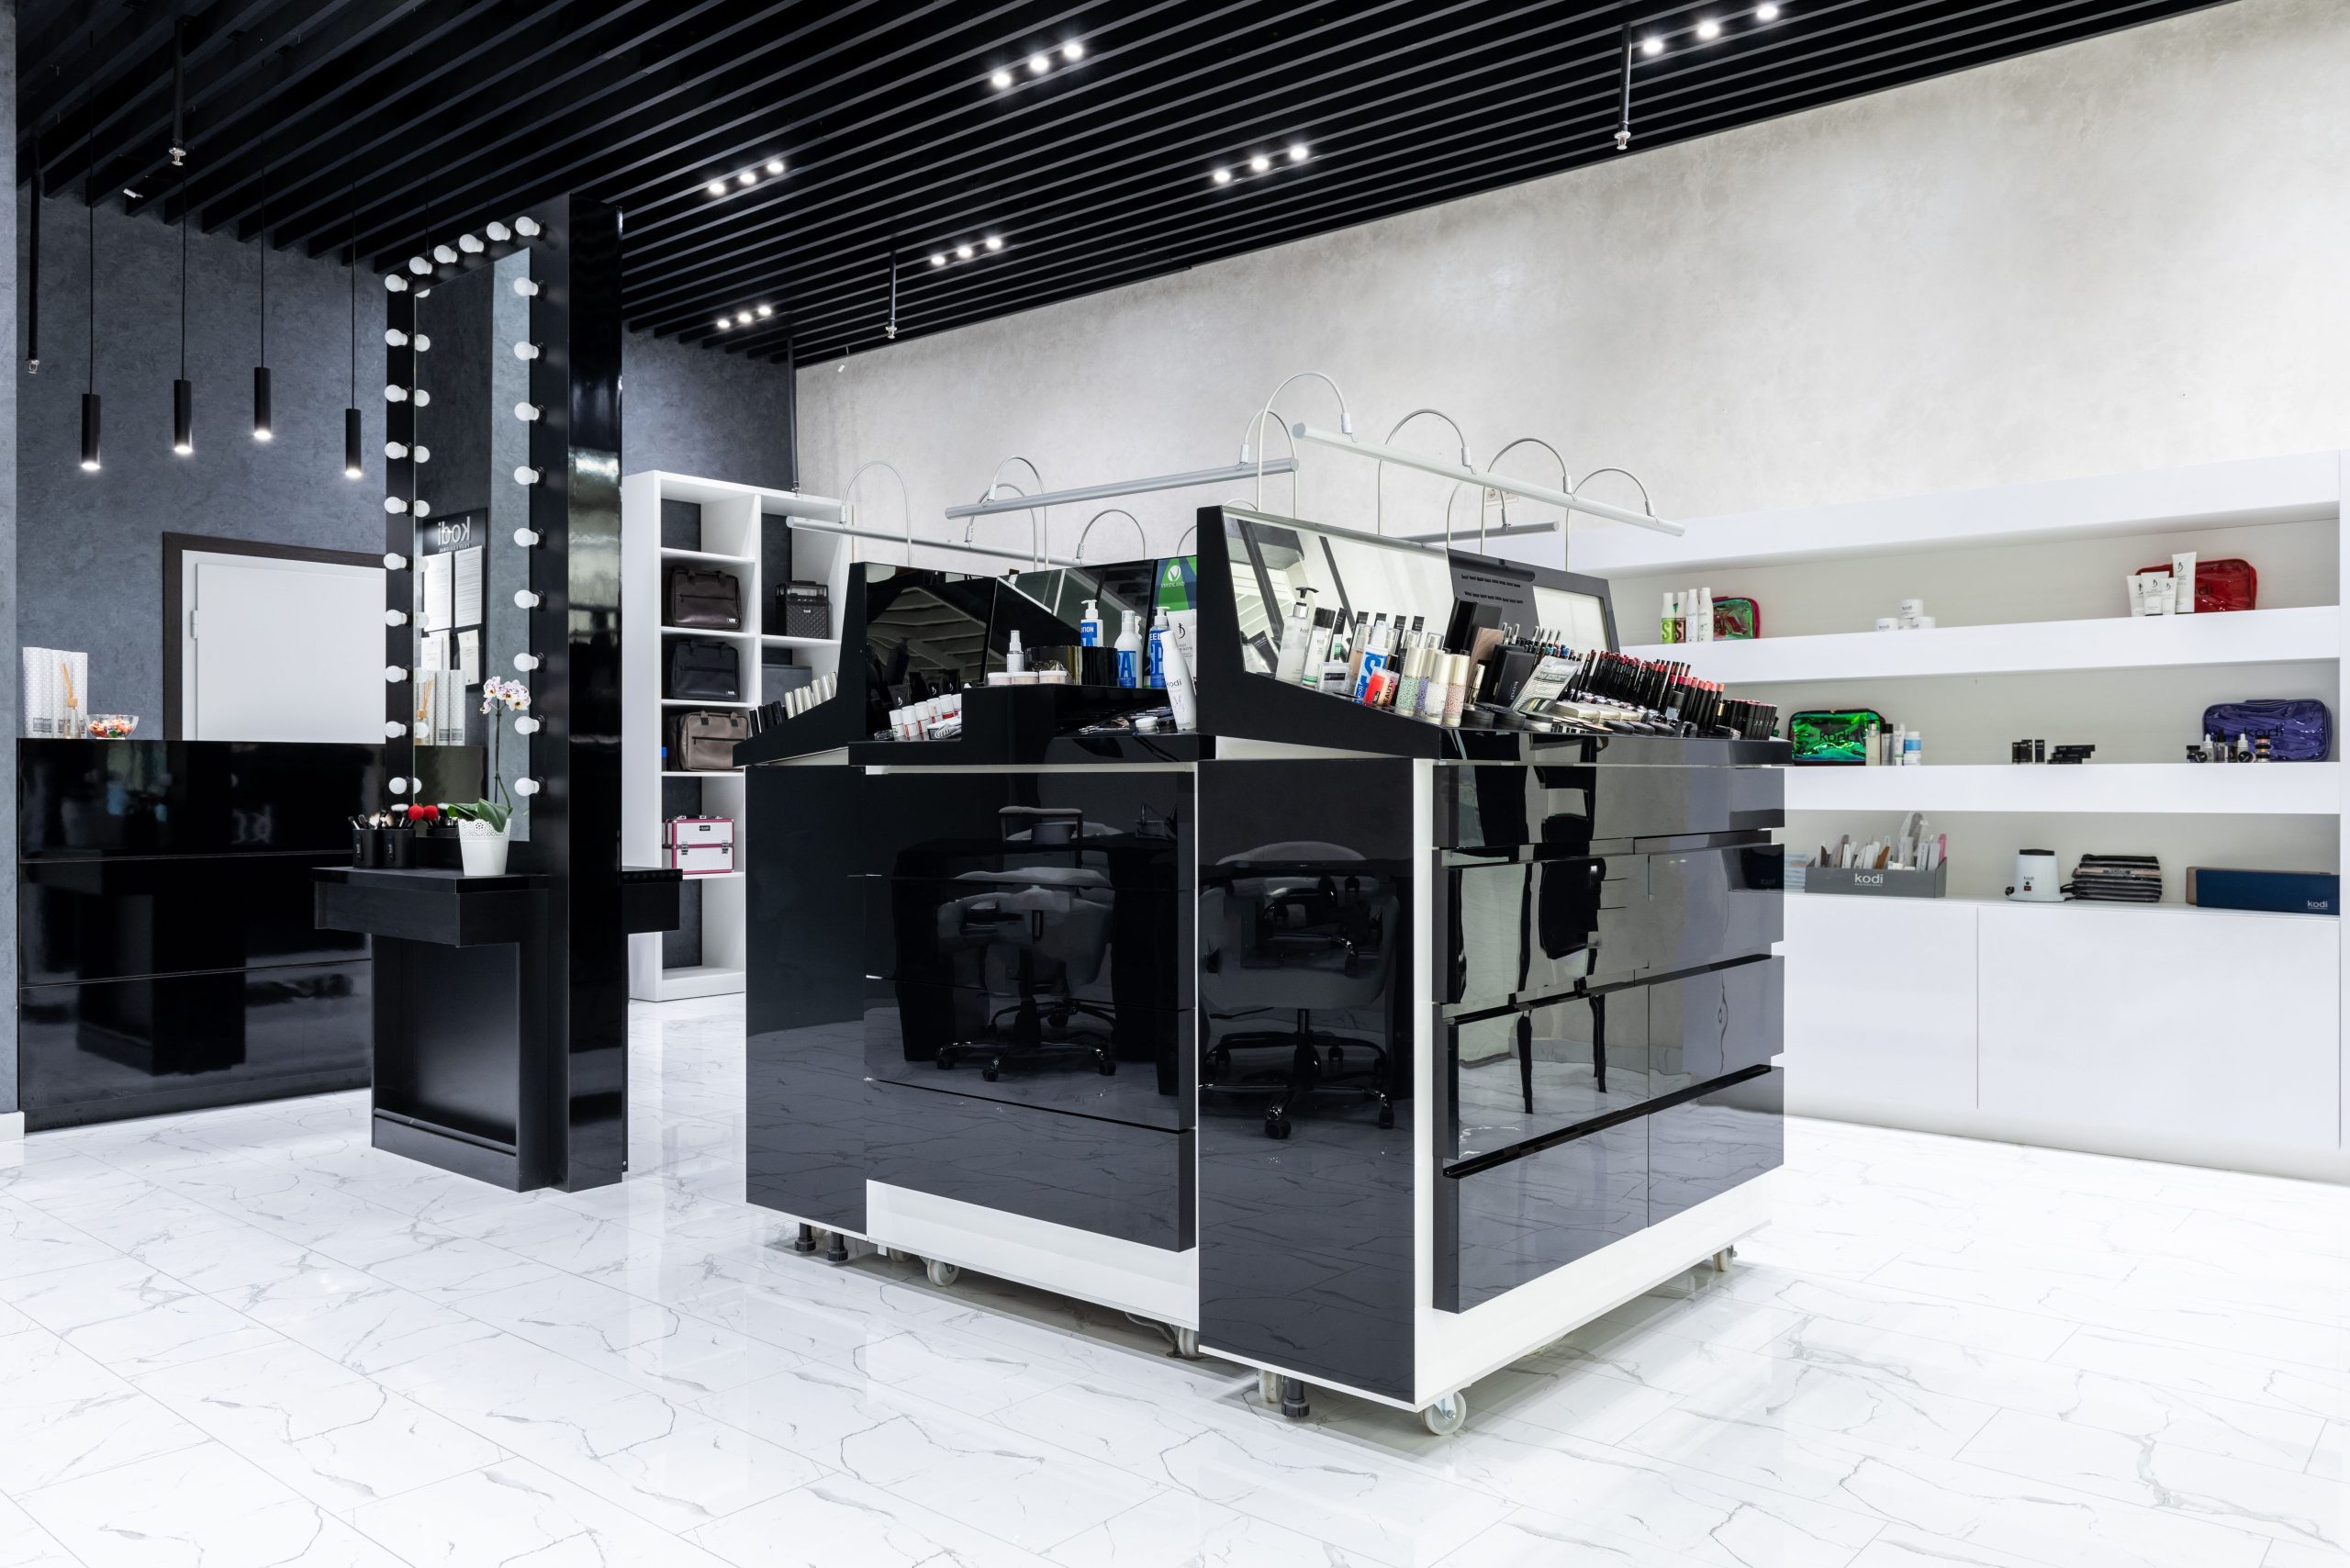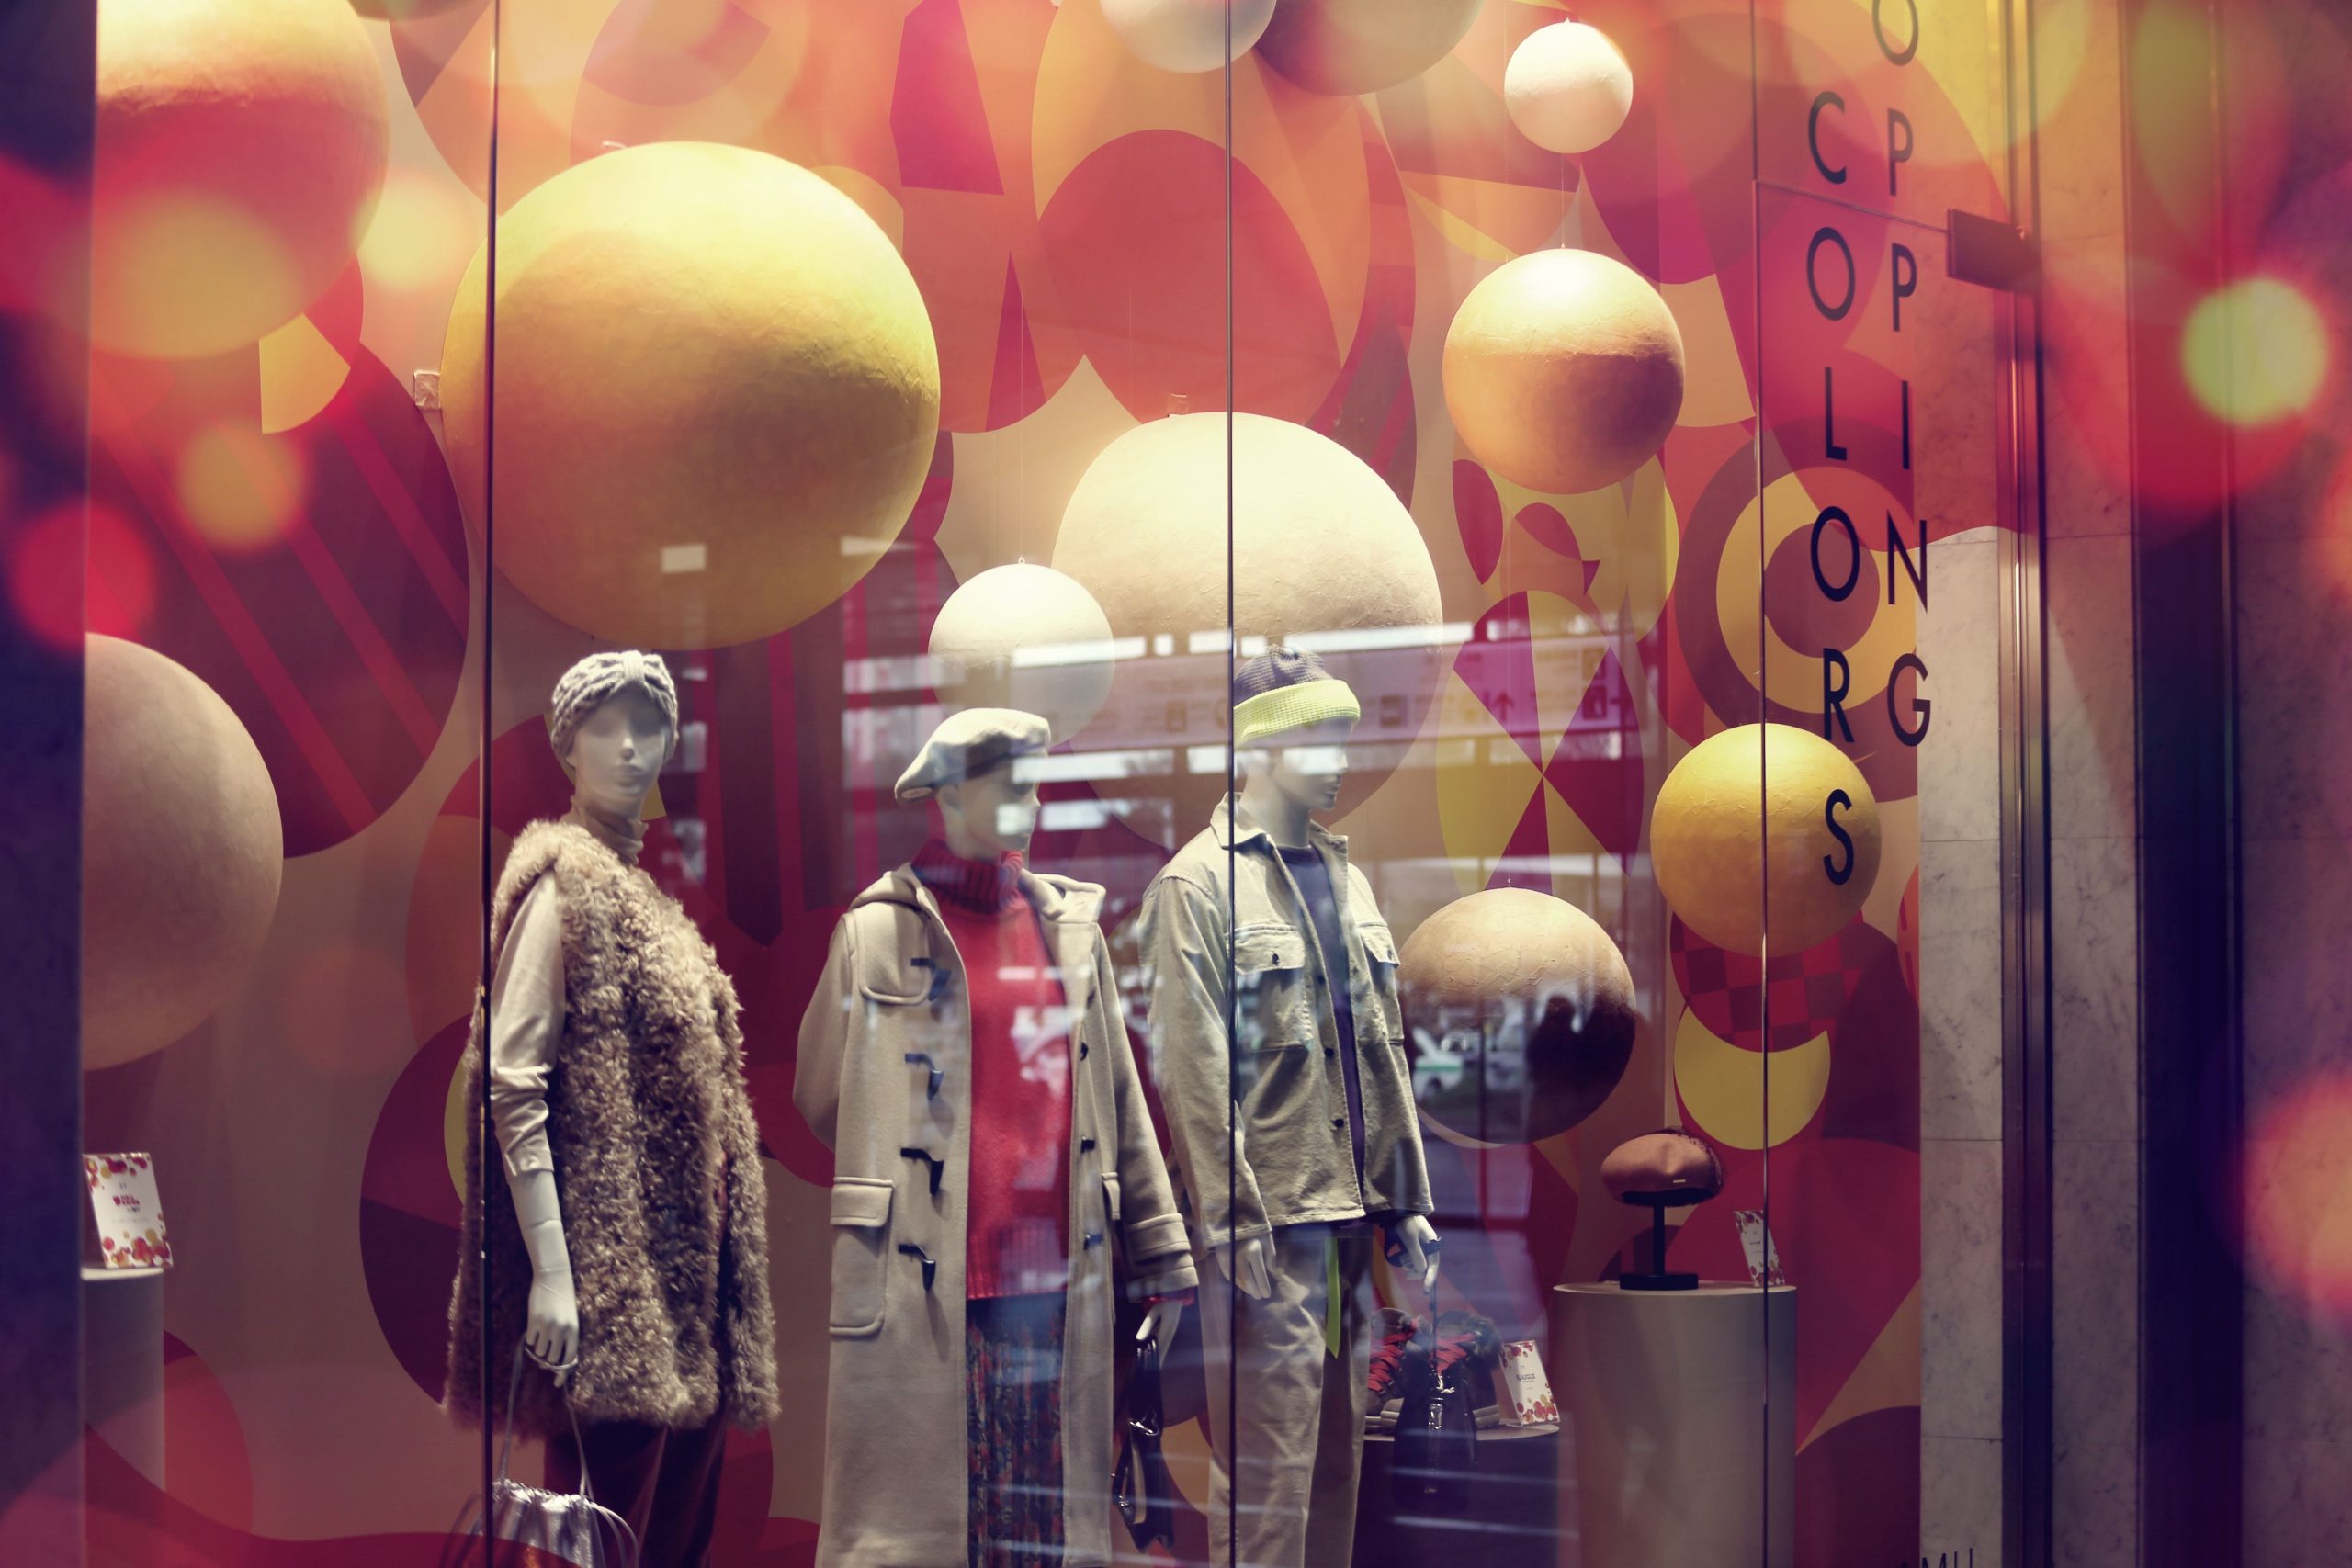

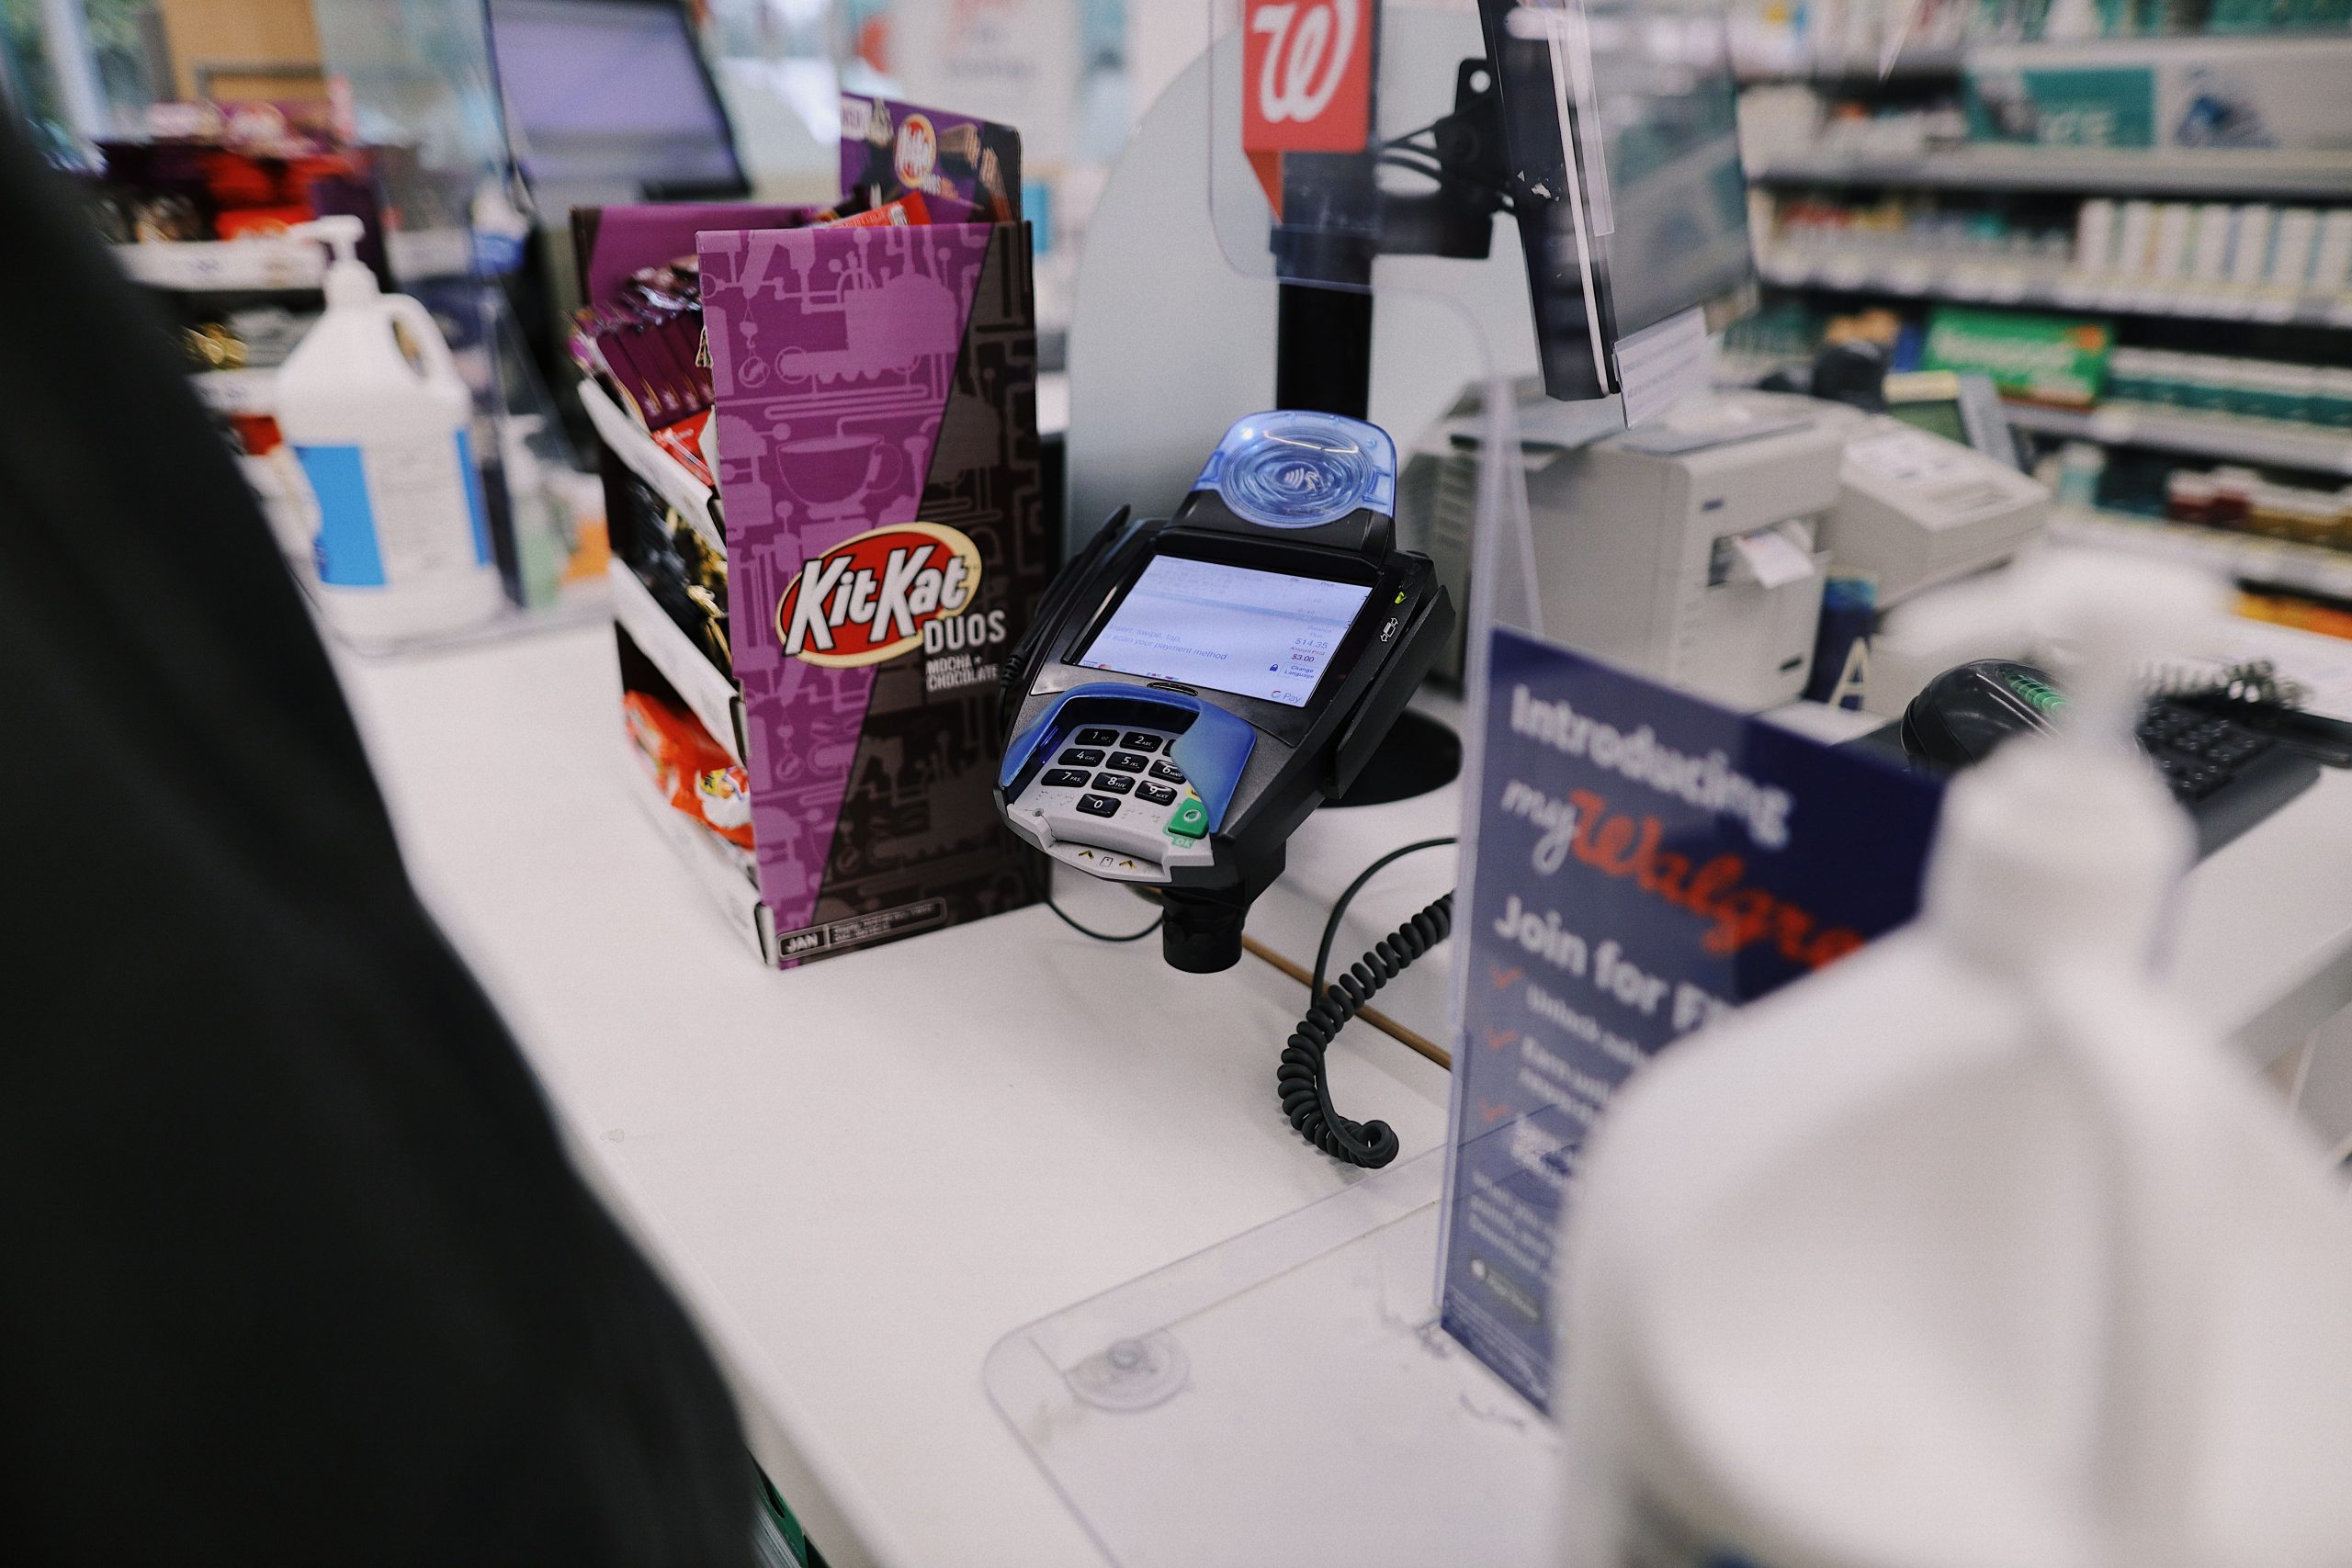
Walk into almost any shop and within a few steps you meet the persuaders: a stack of snacks by the till, a bright endcap at the top of the aisle, a floor stand parked in the path to the eggs. Some are little more than cardboard display stands; others are networked screens. Both are cheap to deploy and easy to get wrong.
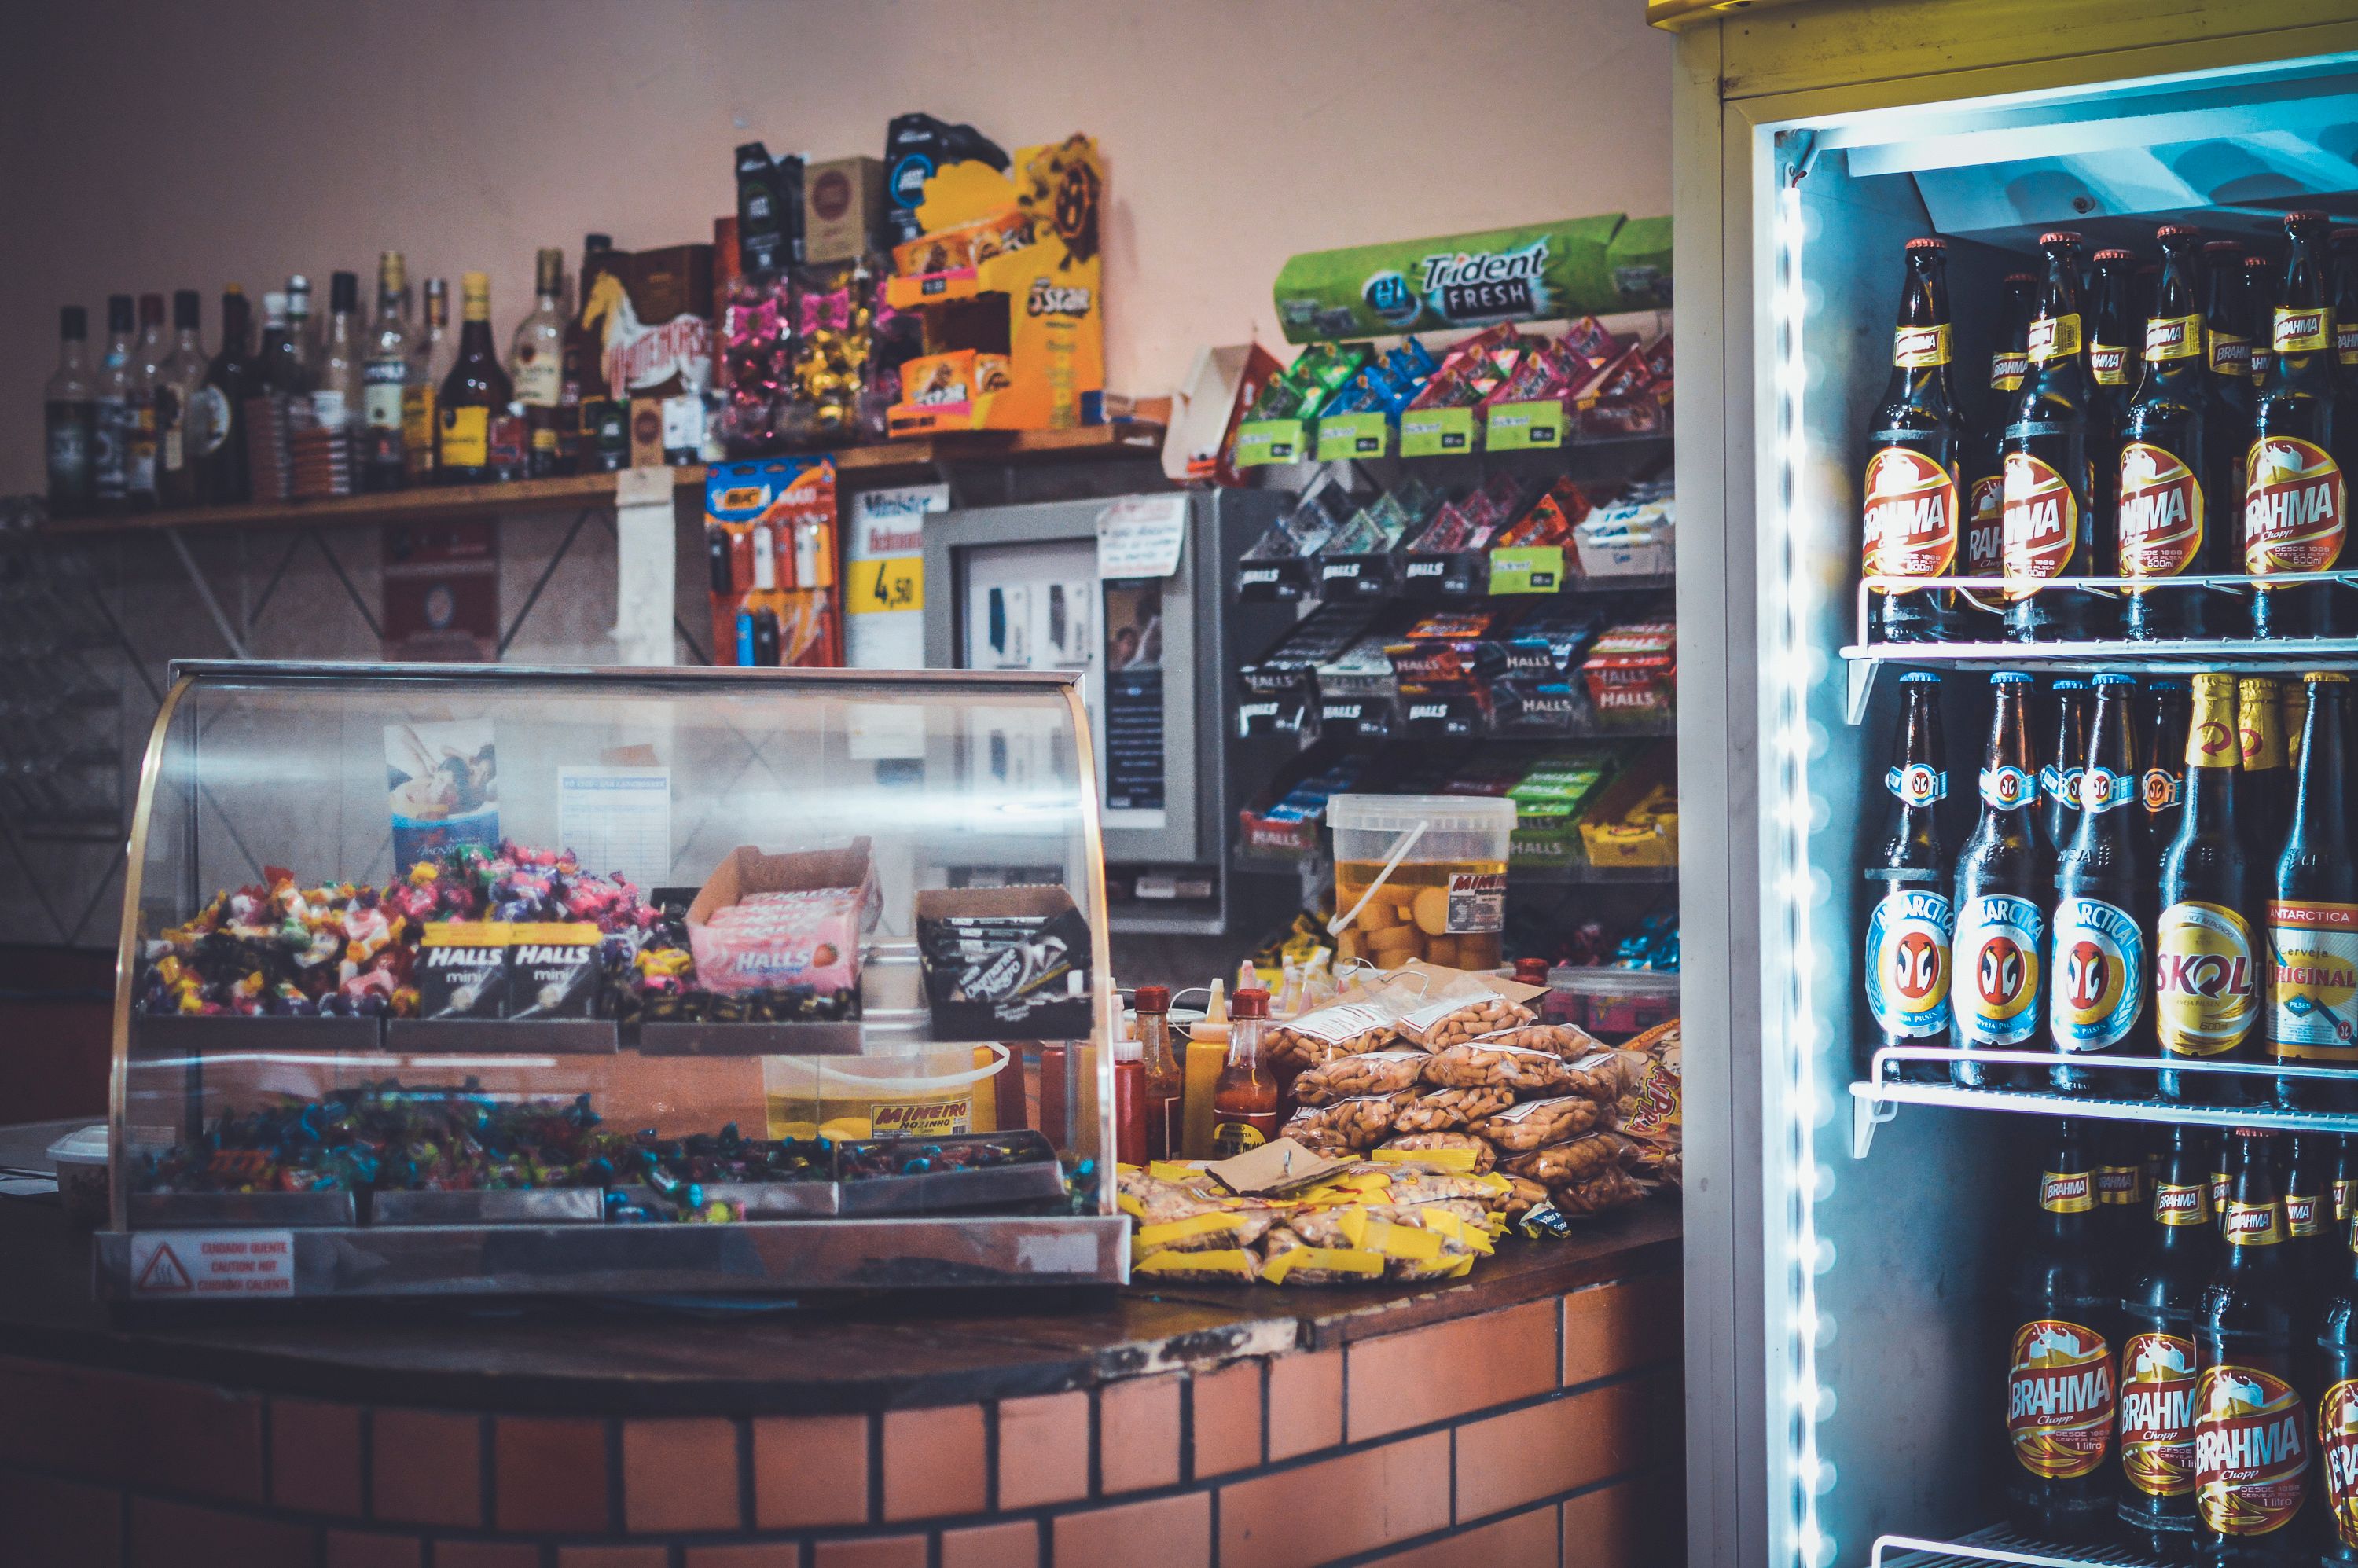
The starting fact is old but stubborn: most buying decisions are not made before the trip. POPAI’s 2012 Shopper Engagement Study, built on pre- and post-shop interviews with 2,400 shoppers, put the in-store decision rate at 76%, up from 70% in 1995. More than one in six brand purchases happened on a trip where that brand had a display present. Newer survey work agrees. A Frank Mayer report published in February 2026, polling 1,119 US shoppers, found 76% had discovered a new product or brand from a retail display, and 63% said a display had swayed them when comparing similar products.
Here is the part the display catalogues tend to leave out: a display is far better at steering which product goes in the basket than at making the basket bigger. My read is that the display’s real job is to win the moment of comparison, not to inflate the spend – and shops that measure it the wrong way end up over-investing in floor space and under-investing in placement.
Table of Contents
Selection, not spending, is where displays earn their keep
The cleanest evidence comes from a 2025 field study in the Journal of Marketing by Dennis Herhausen, David de Jong and Dhruv Grewal. They matched in-store video ad exposures to individual receipts across 237 campaigns and roughly 30 million shoppers between 2018 and 2022. Digital signage lifted the purchase probability of the featured product by 8.1%.
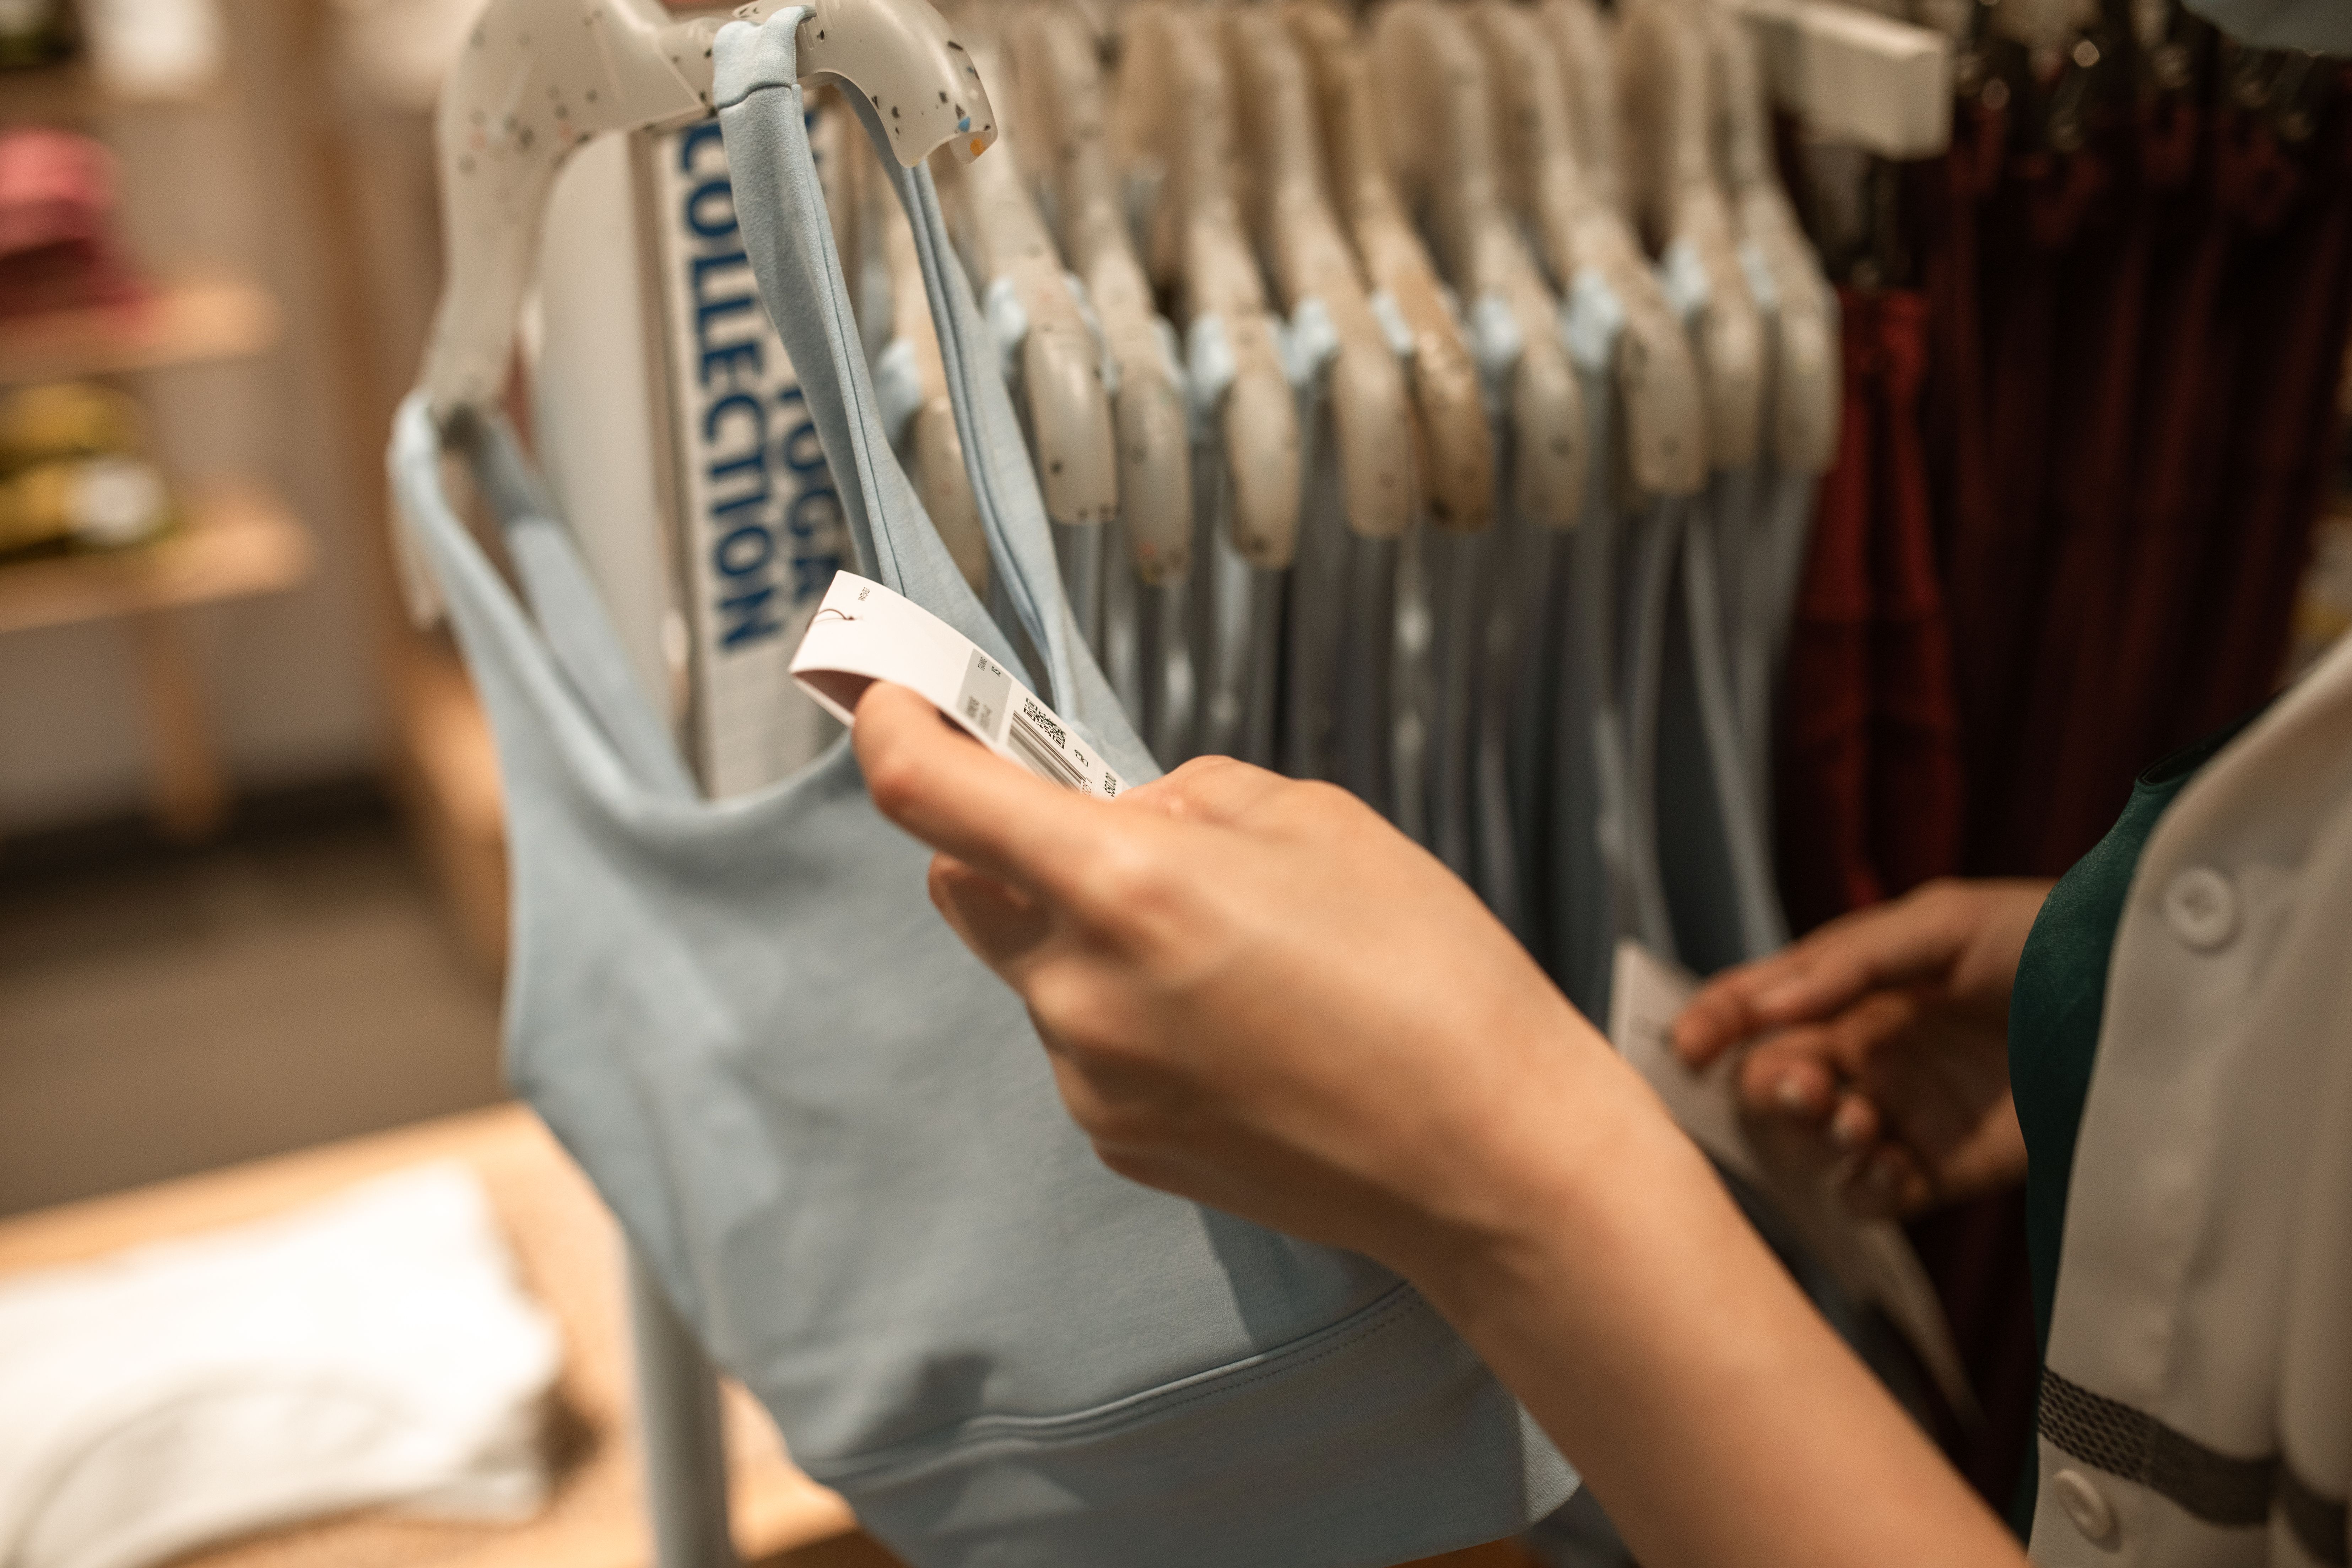
What it did not do is raise spending among the people who bought the featured item – unlike a price promotion, the screen did not change how much those shoppers paid. The valuable lift was elsewhere: exposure made shoppers more likely to buy other products from the same brand (up 8.7%) and less likely to buy a competing brand (down 12.5%), with a positive spillover to the whole category. In other words, the display worked by changing the composition of the basket, not its size.
That distinction should change how a retailer judges a display. If the goal is incremental category demand, point-of-sale displays are a reasonable tool. If the goal is a bigger average transaction, a display might just move a sale that was already going to happen.
Different displays, different jobs
Treating “point-of-sale display” as one category is how budgets go wrong. A US soft-drinks panel study in the Journal of Retailing isolated six display positions and found each moved a different lever: purchase incidence, brand choice, or neither.
Figures: Herhausen, de Jong & Grewal (2025); soft-drinks panel study, Journal of Retailing (2021); Garrido-Morgado & González-Benito (2023); Weimar, Deutscher & Decker (2020); Streicher, PLOS One (2026).
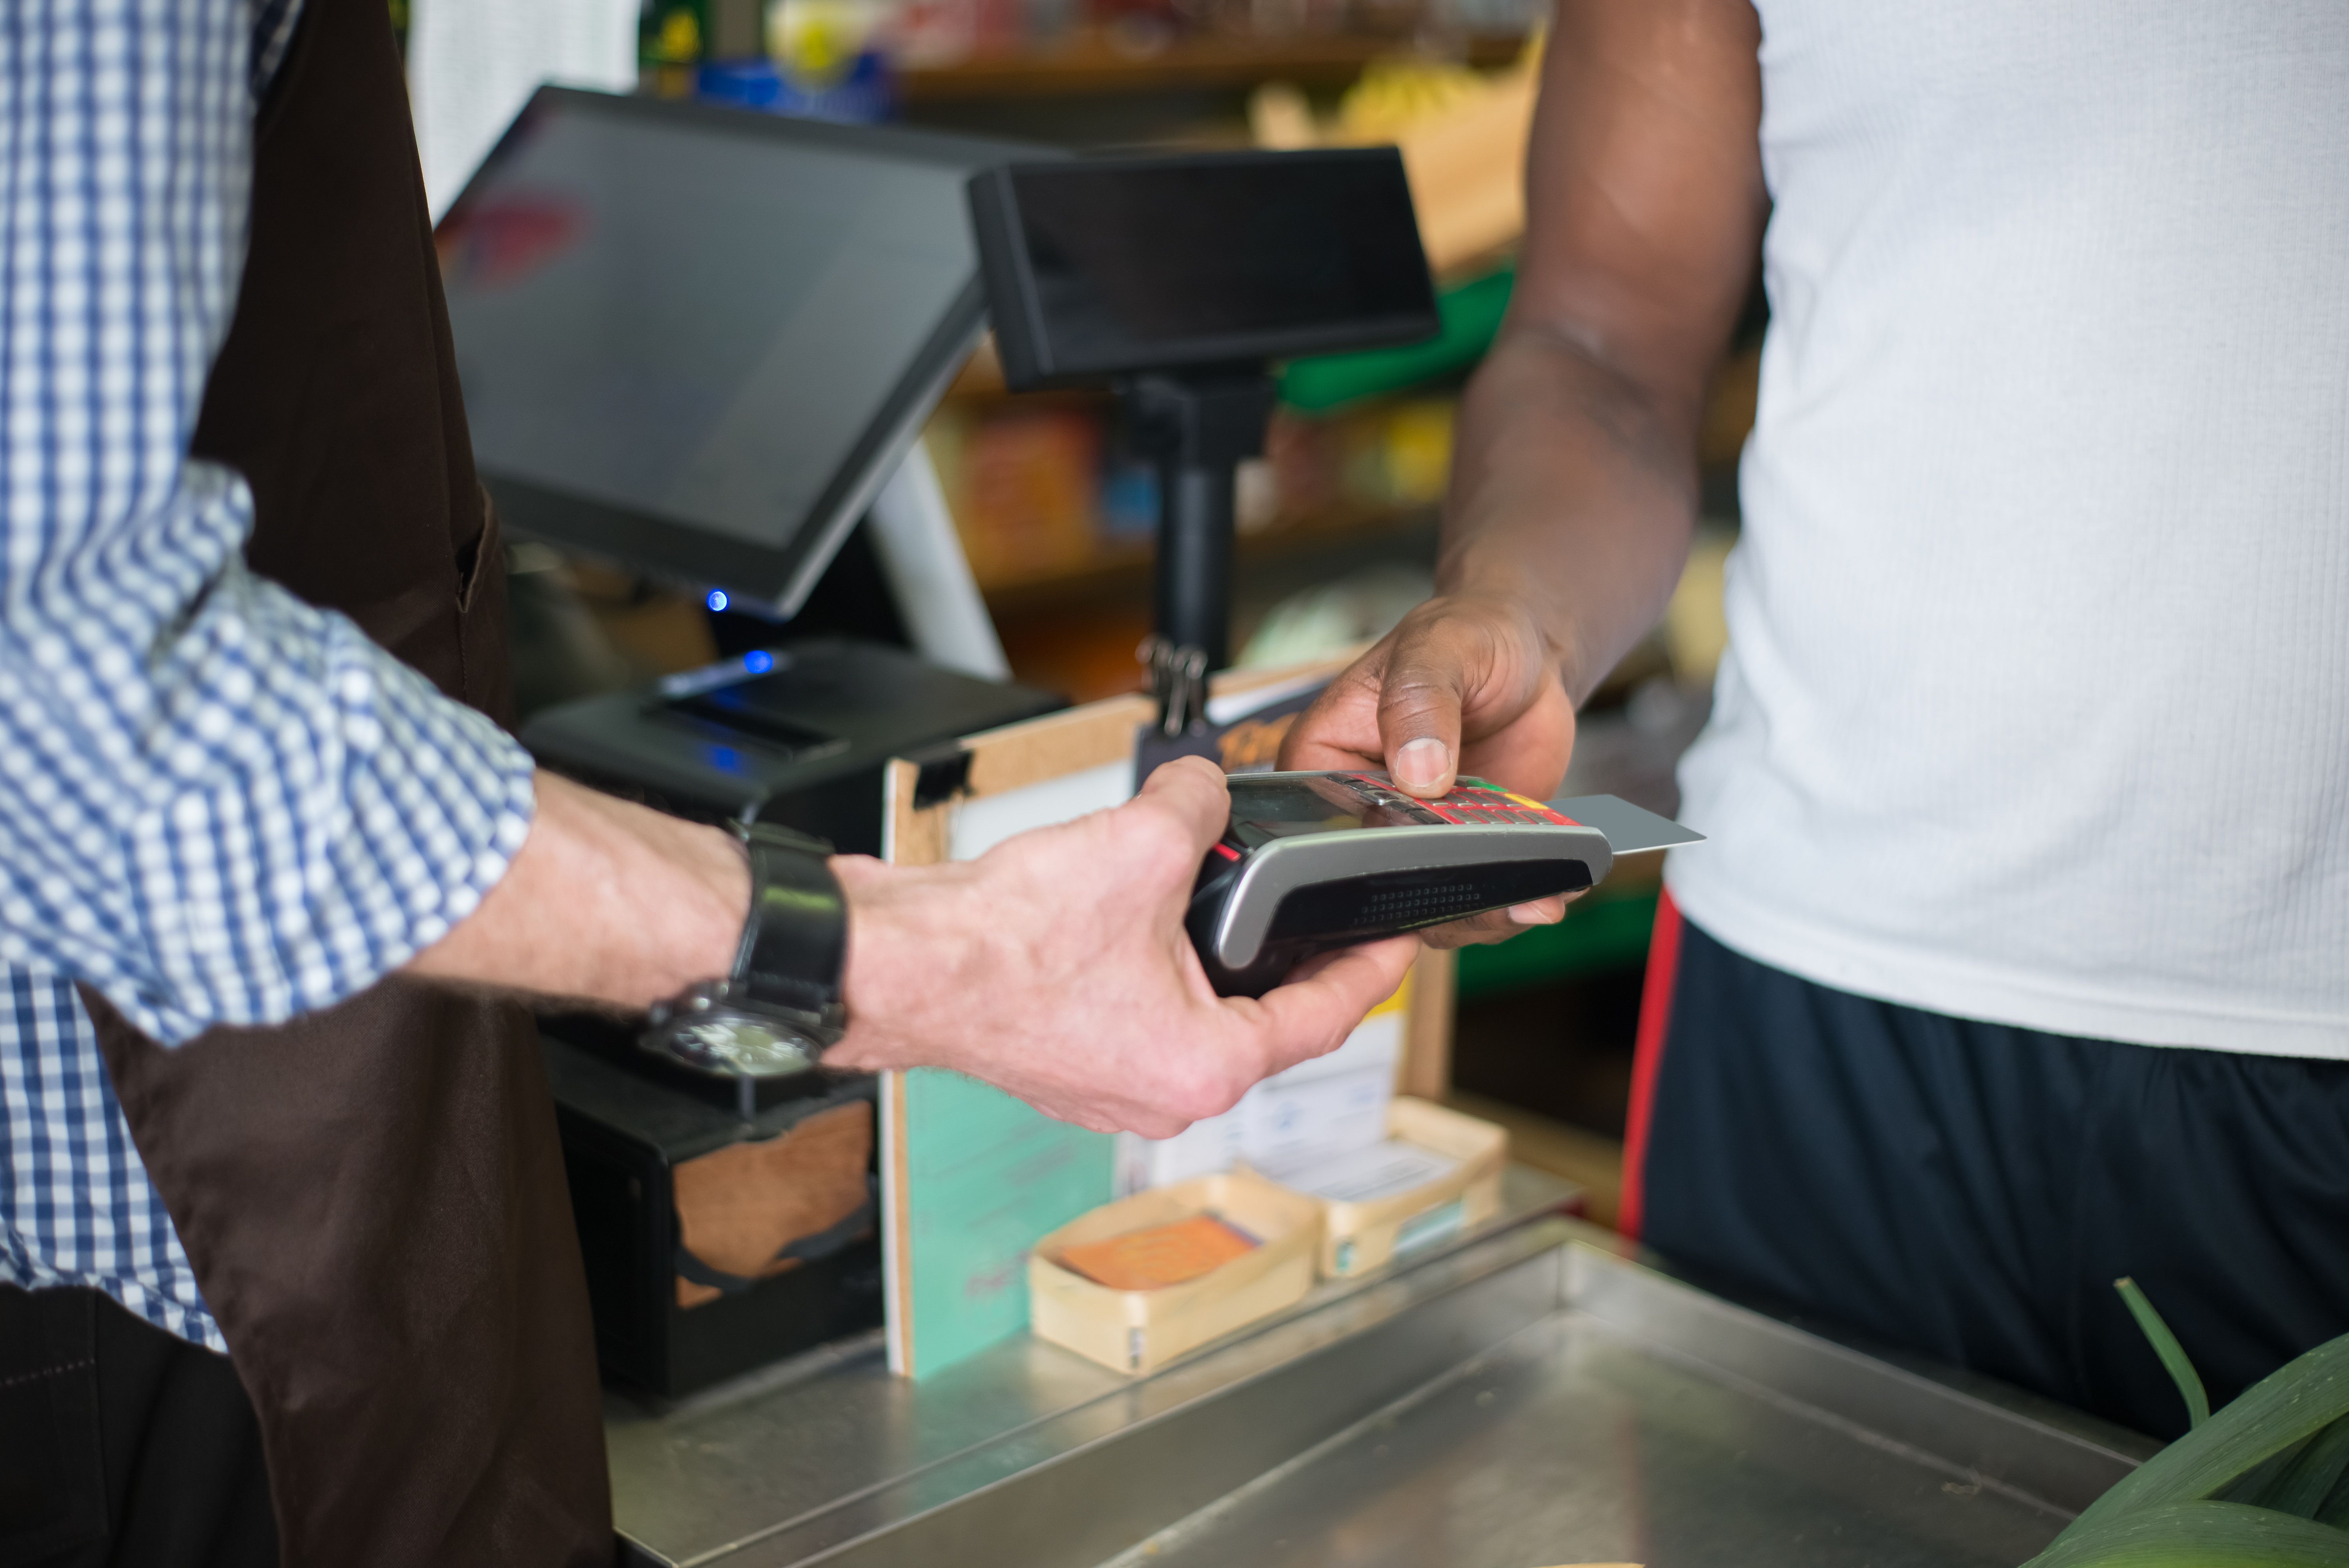
Notice how differently the checkout display and the shelf sign behave. The checkout form wins on impulse, which is why the most banal products – gum, batteries, lip gloss – show some of the largest lifts there. The shelf sign wins on choice, which is why it tends to matter more for own-label and lower-share brands a shopper would not otherwise consider. The front endcap is the only one that reliably pulls people into a category they had not planned to visit.
Attention is the first filter, and it is not the same as persuasion
Every display runs through the same sequence: get noticed, then get evaluated. The eye-tracking research is unusually clear that these are separate stages. In a Journal of Marketing study, Pierre Chandon and colleagues found that the number of facings had a strong effect on attention that carried through to brand evaluation, but that shelf position was messier: top and middle shelves both drew more attention, yet only the top shelf converted that attention into a better evaluation.
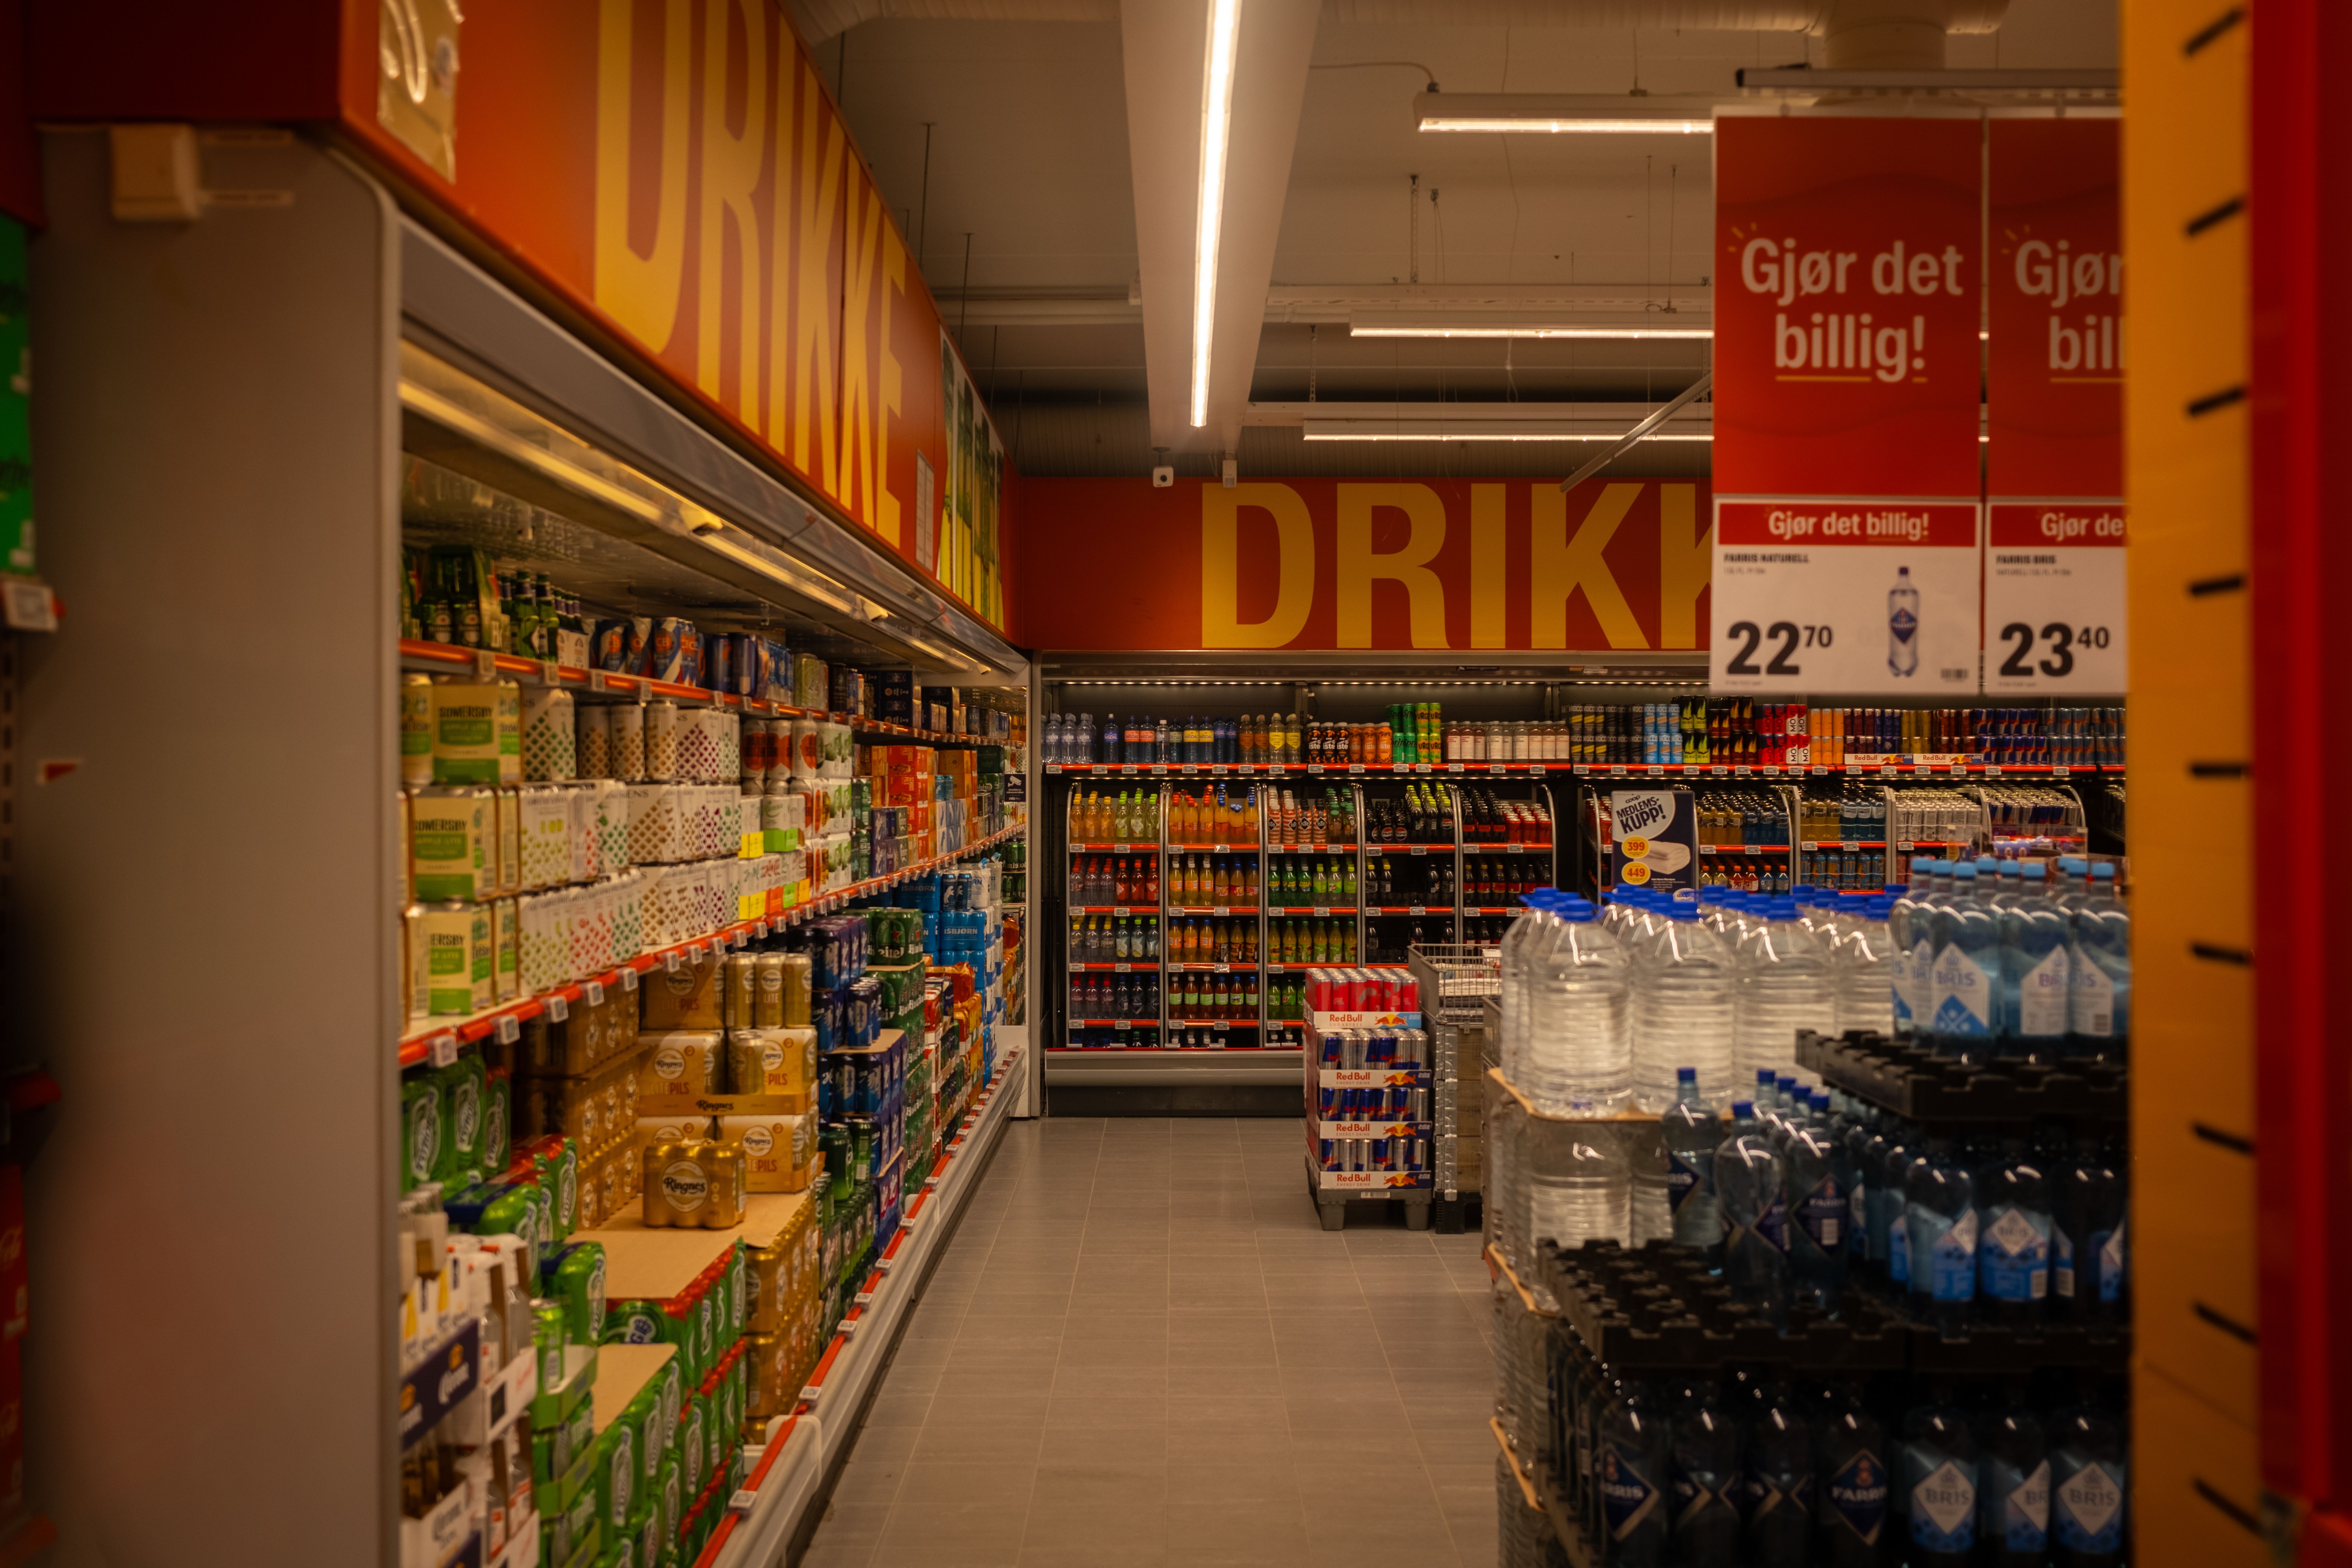
So a display can win the eye and still lose the sale. That gap explains a lot of disappointing display investments – the shopper saw it, considered it briefly, and then bought what they came for anyway.
“Eye level is buy level” is mostly folklore
It gets repeated so often that it functions as retail law. The field data does not back it. A large in-store ambulatory eye-tracking study found the point with the greatest pull on attention sat roughly 14.7 inches below eye level – about 47 inches off the ground for the average shopper – and that this spot drew around 16% more attention than either the top or bottom shelf. The same study found a lateral bias too: shoppers were about 21% more likely to look at products on their right as they walked an aisle.
A field experiment in North American convenience stores added a second wrinkle: the eye-level effect depended heavily on how the planogram was reorganised. Moving products to eye level raised sales by 5.6% to 10% when one pair of product sets was swapped, and did nothing when the reorganisation was larger. The lesson is not that shelf height is irrelevant. It is that height and assortment interact, and a single slogansized rule cannot capture that. I would not build a planogram around the eye-level rule alone; I would test it against actual sales in the store, because the effect shifts with the surrounding choices.
When a display actively costs you sales
The most useful counterweight to display enthusiasm is crowding. A 2026 field study in PLOS One by Mathias Streicher found that mid-aisle fixtures create spatial crowding – a sense that the shopper’s freedom to move has been constrained – and that this suppresses purchase behaviour at the aisle level. In one experiment, removing mid-aisle fixtures increased sales despite displaying less merchandise. Cart users were hit hardest, because a cart makes every obstruction feel more intrusive.
The clutter effect shows up in survey data as well. A 2025 visual merchandising report by One Door found roughly 40% of shoppers called messy or cluttered displays their biggest frustration, and estimated the resulting lost sales in the billions annually. Kantar’s 2026 analysis of shopper behaviour makes the mechanism plain: more than half of shoppers follow the same physical path trip after trip, and stores they return to repeatedly harden that path into habit. A display placed off that route is invisible; a display that blocks the route is an obstacle.
I think this is the most underrated point in the whole field. The instinct to add more displays has diminishing returns, and past a threshold it turns negative. The skill is not how many displays you can fit, but how few you can place well.
How to spend a small display budget
For an independent retailer, a few principles follow from the research more than from tradition:
- Put the display on the route shoppers already walk. Habit is stronger than novelty, so borrowing an existing path beats trying to create a new one.
- Match the format to the job. Own-label and lower-share brands want on-shelf signage; impulse add-ons want checkout or floor stands; category-building wants an endcap.
- Keep it near the product it advertises. Proximity strengthened the effect of digital signage in the Journal of Marketing field study.
- Resist the pile-up. If the fixture narrows an aisle, you can lose more across the aisle than the display gains at the brand level.
- Run it as a test, not a commitment. Compare treated stores with control stores before and after, the way the checkout-display field study did, rather than trusting a before-and-after number from a single store.
FAQ
Do point-of-sale displays actually increase sales?
Do displays change what people buy or how much they spend?
Where is the best place to put a point-of-sale display?
Is eye-level placement always best?
Are digital displays more effective than cardboard ones?
How do you know if a display worked?
The bottom line
Point-of-sale displays are a precision tool, not a volume play. They earn their keep by intercepting a decision that has not been made yet – the shopper who arrives knowing they want soft drinks but not which one, or the one who came for bread and leaves with a snack. The evidence says to place few displays, put them where people already walk, match them to the decision you want to influence, and watch the whole aisle rather than just the product. Do that, and the display pays for itself. Skip it, and you have added clutter to a route shoppers are trying to finish quickly.