Every company has different teams and roles, but things can get confusing without a clear structure. This is where organizational charts come in handy. These charts visualize who’s in charge of what and how everything fits together in the company. They also make it easier to understand who reports to whom and how different roles connect.
Now, creating these charts is a special skill, but software like EdrawMind makes the process super-easy. It is a tool with all the features needed to create an org chart. So, in this guide, let’s explore more about these charts and how to use EdrawMind to create them easily. Let’s dive in!
Table of Contents
Key Elements of Organizational Chart
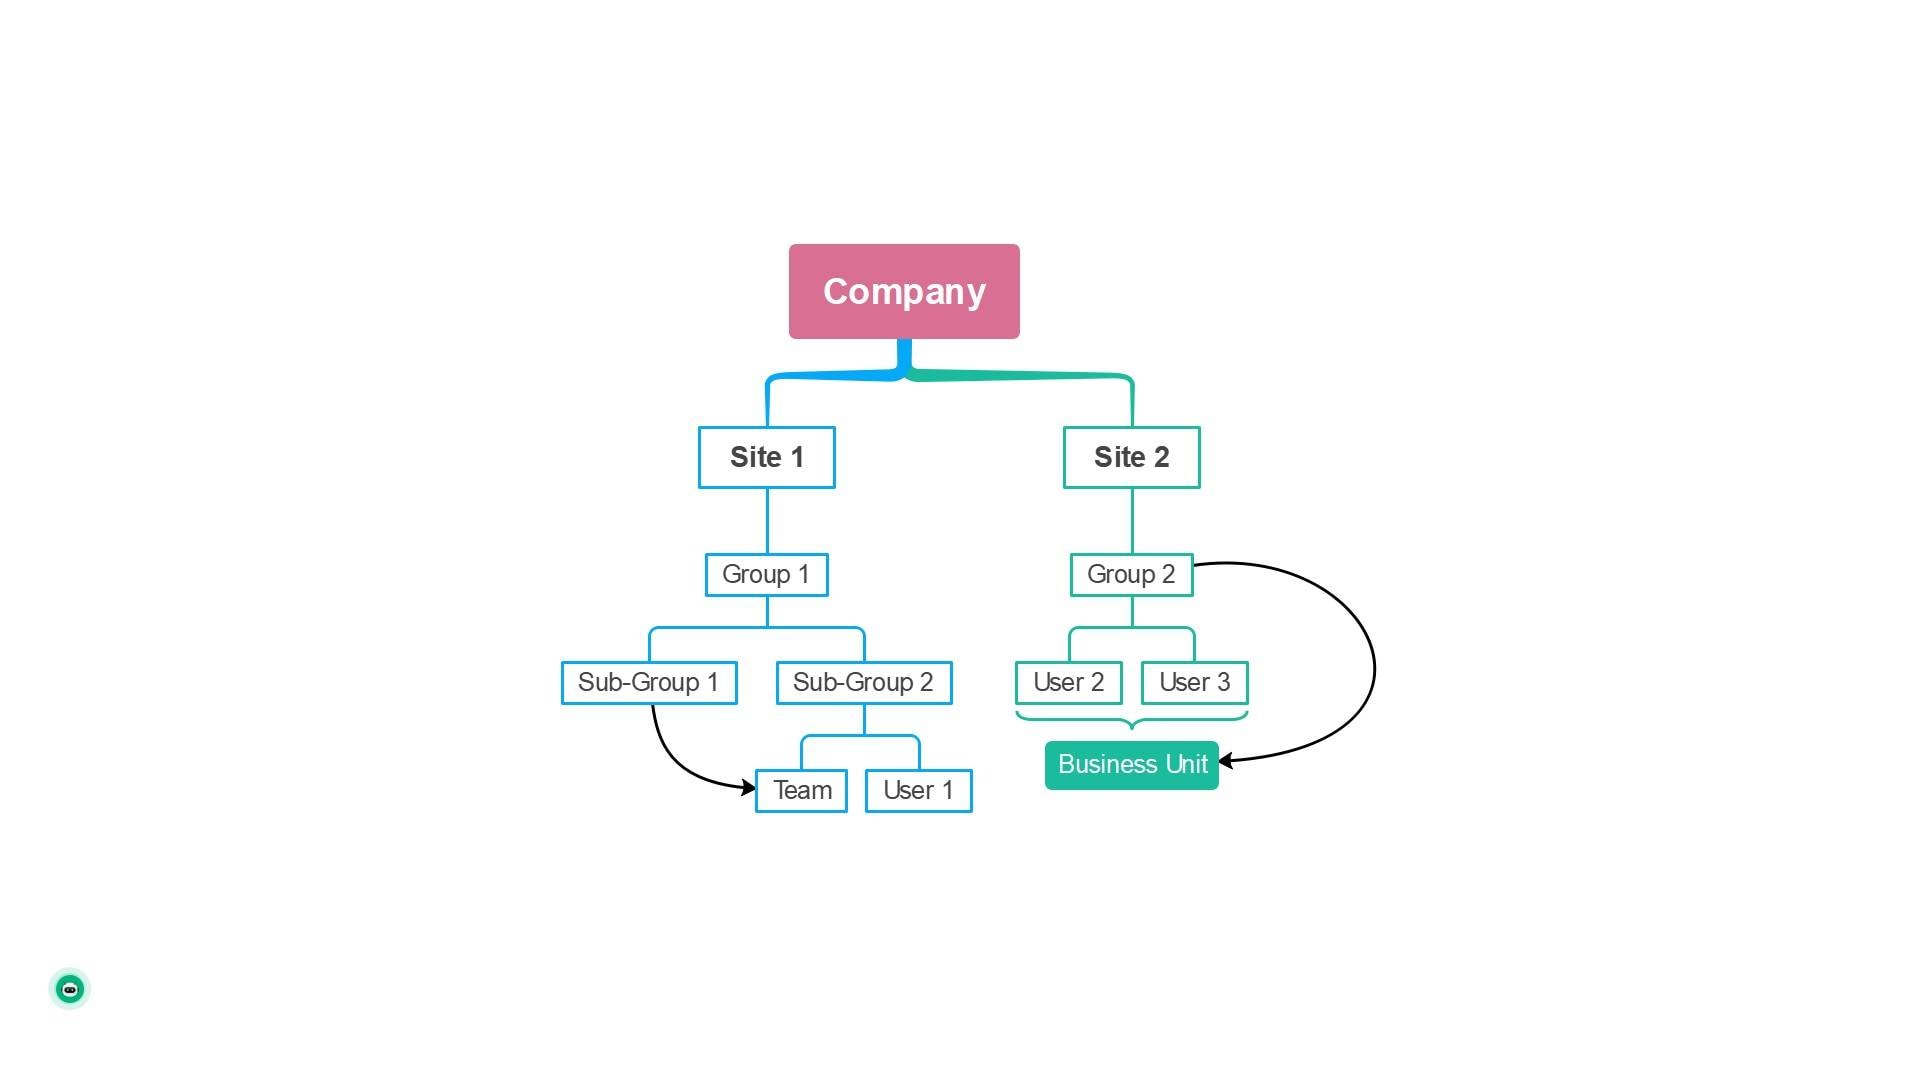
Source: edrawmind.com
The following are the key elements of an organizational chart.
Hierarchical Structure Showing Relationships between Positions
The basic purpose of an org chart is to illustrate the hierarchical framework of a company. In other words, it visualizes the entire chain of command.
Such a structure places the highest authoritative figures at the top. It can be the CEO, department head, or company president. Then, as we move down, the chart showcases individual job roles. Here, it focuses on all the employees and positions in the company.
When an org chart is created this way, it carries all the departments, units, and teams in a company. One glance at the chart, and you can see who is responsible for what and who reports where throughout the organization.
Depiction of Roles, Responsibilities, and Reporting Relationships
A company has many employees, roles, departments, and teams. If all these things are not organized properly, understanding even the basic structure of the organization can be hectic. This is why an org chart is great for depicting the roles and responsibilities of every employee in the company.
Division of Labor and Span of Control
The organizational chart visually represents how work is divided among different roles in the company. It showcases the specific tasks and responsibilities that each employee is skilled at. With an org chart, you can present this information in a single view. This allows for boosting overall work efficiency and productivity.
Besides the chart also shows the relationships between supervisors and their subordinates. It includes the number of people who report to a manager or supervisor.
Identification of Management Levels and Leadership Hierarchy
You can clearly see through an org chart the different levels of management in a company. It shows the layers of authority in the organization. So, employees can get a better understanding of who is in charge and how management is structured. Ultimately, productivity will boost as employees will know where to go for guidance and who to talk to.
How to Create Organizational Chart in General?
Making an organizational chart is easy if you know the right steps to follow. Otherwise, it will soon become exhausting over arranging all the data. Here’s a quick guide for the three key steps to create an organizational chart:
1. Identify the Organizational Structure and Key Positions
There are several things that you should do before you actually start making the org chart. That is, to make sure you have all the data to enter in the org chart. Otherwise, it will take a lot of time to revise the connections within the chart.
Keep the following points in mind:
- Learn deeply about the organization’s structure.
- Familiarize yourself with key departments, teams, and positions in the company.
- Keep track of all the roles and reporting connections, from top-level management to overall staff.
2. Choose the Type of Organizational Chart
Once you have gathered all the data, it’s time to decide how to display it in the chart. There are many different types of org charts you can go for, such as:
- Hierarchical Chart. Best for traditional, top-down structures with clear reporting paths.
- Matrix Chart. Ideal for companies with cross-functional teams and multifaceted reporting lines.
- Flat Organizational Chart. Well-suited for smaller companies with decentralized structures and few management tiers.
- Divisional Chart. Ideal for large organizations with multiple branches.
3. Add Departments, Teams, and Positions
You can add data to your org chart at multiple levels:
- Start by putting the most important person at the top of the chart, like the company president or owner. If there are many people with the same level of authority, add them all at this point.
- Then, go to the next level down and show other important roles, like managers who directly report to the president. In bigger companies, there might be more vice presidents who manage different things like operations and sales.
- After that, move to the third level. Here, you’ll show positions that report to the roles in the second level. Fill this level with employees and their jobs. Connect these roles to each other and clearly explain what they do.
- Keep repeating this pattern until you reach the bottom of the chart, where the least important position will be.
How to Create Organizational Chart in EdrawMind?

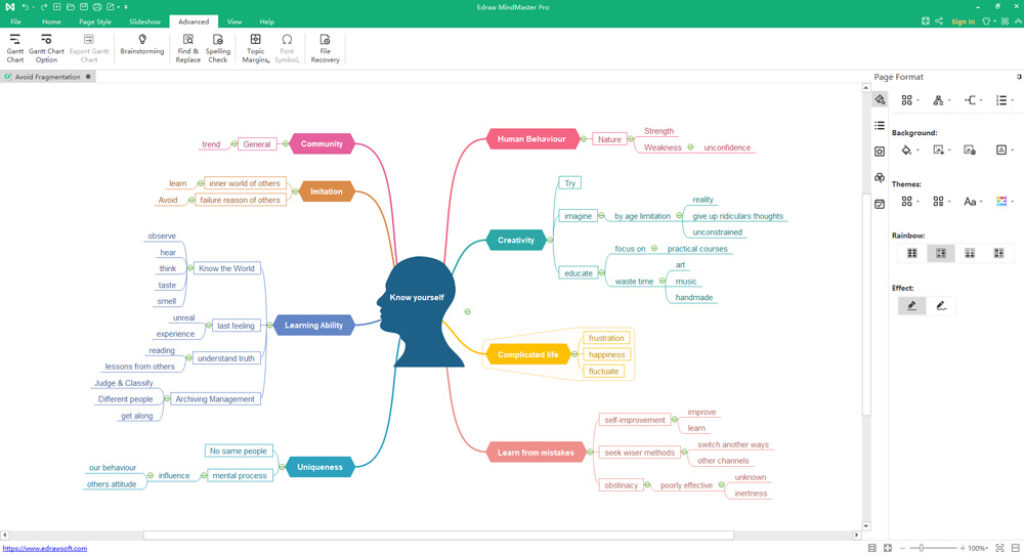
Source: edrawmind.com
If you find it hard to create an org chart, there’s an easy way: EdrawMind – a software specifically designed to help you make diagrams and charts. The best part is? It’s free to use and has lots of amazing features and tools!
So, let’s see how you can use EdrawMind to make organizational charts.
1. Choose Your EdrawMind Option
To create your chart in EdrawMind, you have two options: you can use the EdrawMind Software on your laptop or use EdrawMind online. Both ways work well for making charts, so you can pick the easier one (download the software or use it online). Once you’ve decided, go to the “New” section on the left sidebar and choose a template to start making your org chart.
2. Customize Your Org Chart
After selecting a template, it will appear on the right side of the screen. Now, you can customize it however you want. You can add different shapes, job roles, and other things that show how your company is organized.
3. Save and Export Your Chart
EdrawMind lets you save your chart in different ways, like as a file for Microsoft Office, a PDF, or other types. You can choose your desired format and easily save your created org chart to your device.
Conclusion
In a nutshell, organizational charts are like maps that show how a company works. They help you know who does what and where everyone fits in the company. While you can make these charts in a general way, using EdrawMind makes it really easy and quick. It has all the important features and tools you need to create super-effective org charts in minutes! It’s completely free, and you can either download it or use it online!