“There is nothing new in Wall Street. There can’t be because speculation is as old as the hills.”
That line came from Jesse Livermore. One of the most famous traders in market history. What did he mean by that? He meant that markets change. Technology changes. But human behaviour does not change much. Fear. Greed. Optimism. Panic. Those emotions show up again and again in financial markets. And interestingly, they often show up very clearly on stock market graphs.
That is one reason institutional investors spend so much time studying charts. Because charts reveal something powerful. Behaviour patterns! And once you learn to see those patterns, market trends start making much more sense.
Table of Contents
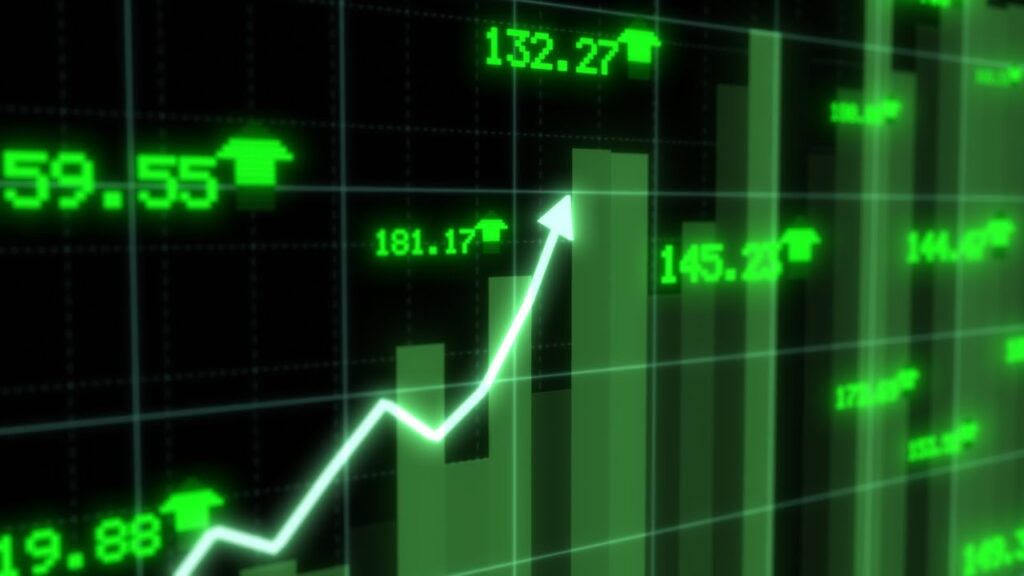
Why Institutional Investors Study Stock Charts

Source: investopedia.com
Institutional investors manage massive amounts of money. We are talking about:
- pension funds
- hedge funds
- asset management firms
- large investment banks
Their trades are huge. Sometimes millions of shares. Sometimes billions of dollars. Because of this scale, they cannot just buy randomly. They need strong signals before entering the market. Stock market graphs help them find those signals. Charts reveal:
- price trends
- momentum shifts
- strong buying zones
- selling pressure
Instead of guessing, they look for evidence on the chart.
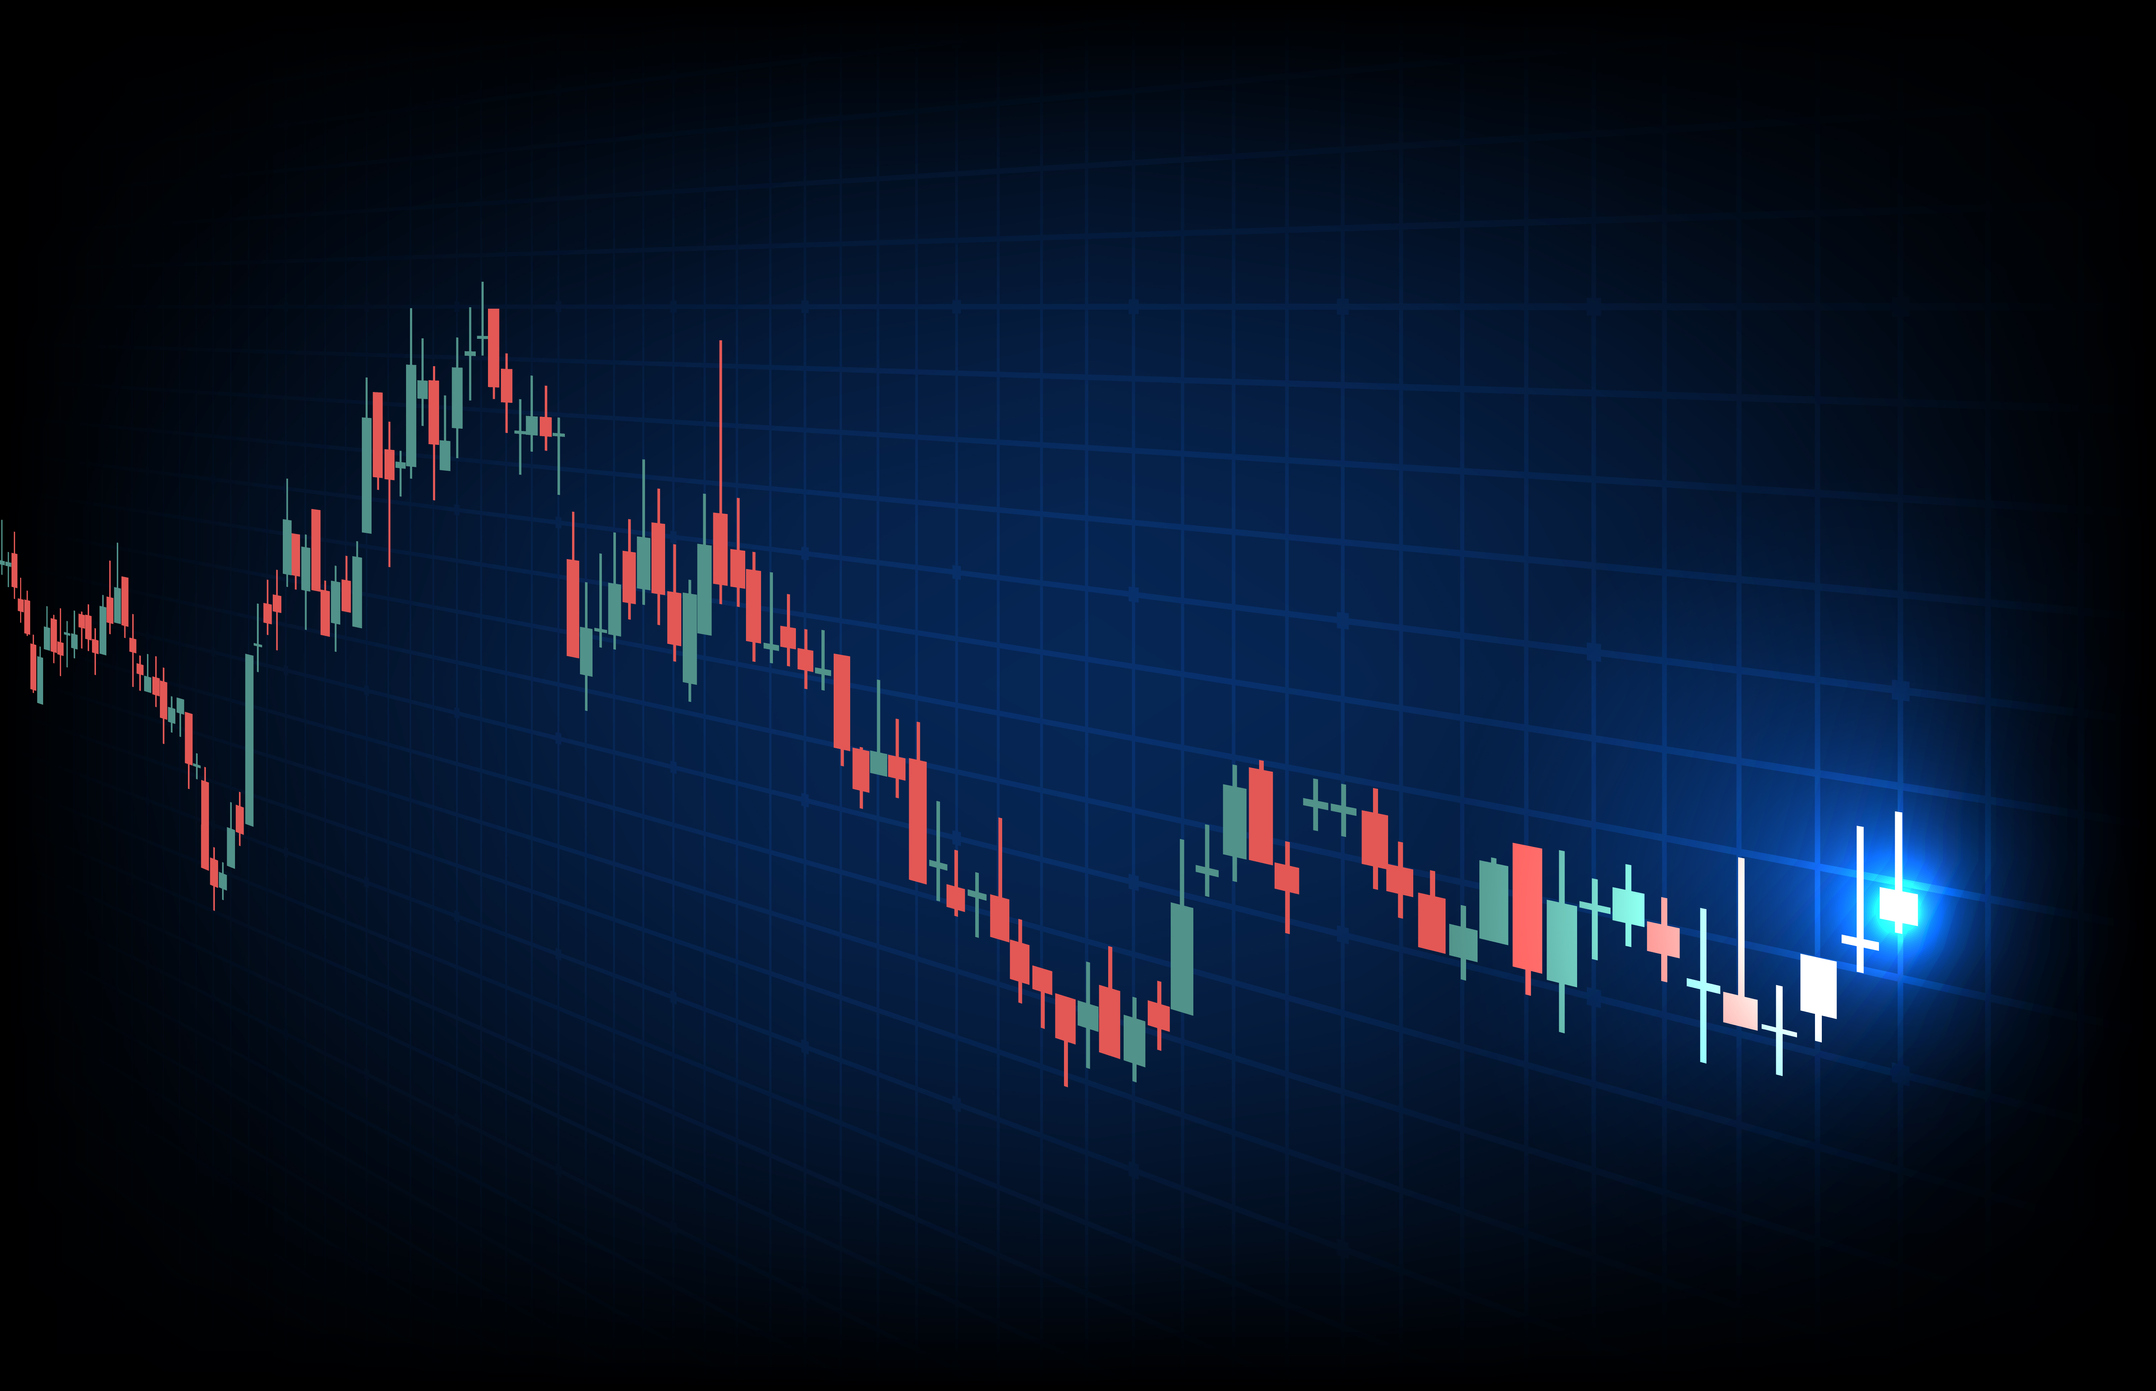
The First Thing They Look For: Market Trend
Source: youtube.com
When professionals open a stock chart, they usually start with a simple question. Which direction is the market moving? Most charts show one of three situations.
|
Market Trend |
What It Means |
|
Uptrend |
Prices keep rising over time |
|
Downtrend |
Prices gradually fall |
|
Sideways trend |
Price moves within a range |
Institutional investors usually prefer to follow trends. Why fight the market? If a strong uptrend exists, funds may look for moments to buy. If a clear downtrend appears, they may reduce exposure. Trend direction is often the first filter.
Support Levels Tell an Interesting Story
Another thing institutions watch closely is support levels. Support is a price area where a stock often stops falling. Why does this happen? Because buyers appear at that level repeatedly. Imagine a stock doing something like this:
|
Price Move |
Market Reaction |
|
Falls to $60 |
Buyers step in |
| Falls again to $60 | Buyers step in again |
After this happens multiple times, investors start noticing a pattern. That price becomes a support zone. Institutional investors watch these areas carefully. Sometimes they place large buy orders near these levels.
Resistance Shows Where Selling Happens

Source: warriortrading.com
Resistance works the opposite way. It is a level where prices struggle to go higher. Selling pressure appears there. For example:
|
Price Level |
Market Behavior |
|
$120 |
Price struggles to rise |
|
$120 again |
Sellers appear |
If the price keeps failing near the same level, that area becomes resistance. Institutions track this closely. Because if resistance eventually breaks, the stock may move quickly upward. That moment is called a breakout.
Volume Reveals Market Confidence
Price alone does not tell the whole story. Institutional investors also look at trading volume. Volume simply means the number of shares traded. High volume can signal strong interest. Low volume may indicate weak conviction. Here is a simple interpretation many analysts follow.
|
Price Movement |
Volume Level |
Possible Meaning |
|
Price rising |
High volume |
Strong buying |
|
Price rising |
Low volume |
Weak momentum |
|
Price falling |
High volume |
Strong selling pressure |
Institutional investors pay close attention to these combinations. Volume confirms whether a move is real or temporary.
Trendlines Help Investors See Structure
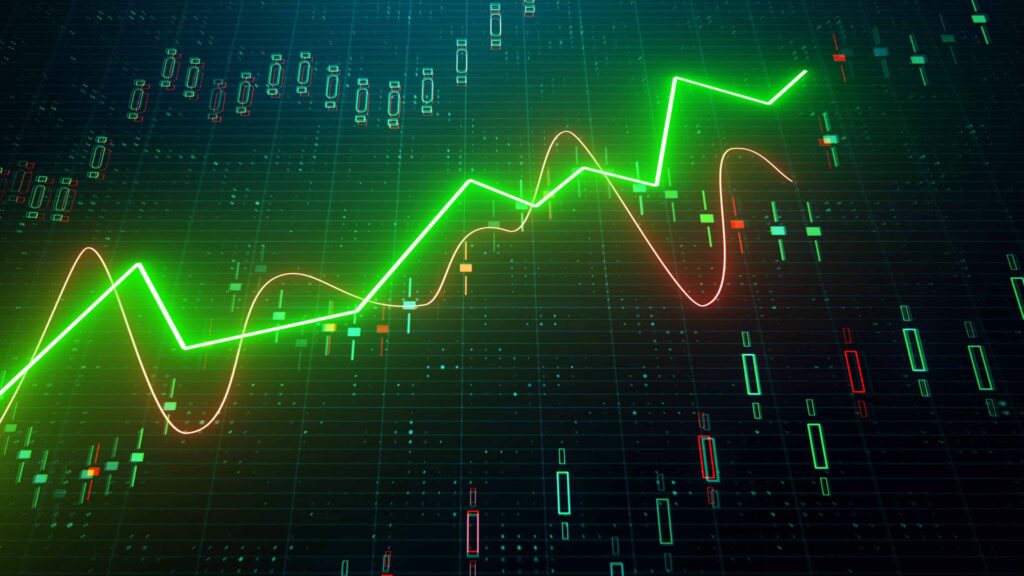
Source: kiplinger.com
Many professionals draw trendlines on stock market graphs. Trendlines connect key points on a chart. These lines help visualise market direction. For example:
- An upward trendline connects higher lows
- A downward trendline connects lower highs
Over time, these lines create a visual structure. If the price respects a trendline multiple times, investors start trusting it. But if the line suddenly breaks, it may signal a change in trend. Institutional investors watch these breaks carefully.
Moving Averages Make Trends Easier to Spot
Charts can sometimes look messy. Prices move every day. Moving averages help smooth that noise. A moving average calculates the average price over a certain time period. Common ones include:
- 50-day moving average
- 100-day moving average
- 200-day moving average
Institutional investors often track these lines. If a stock stays above its long-term average, the trend may be strong. If it drops below, sentiment might be changing. These signals help funds decide whether to increase or reduce positions.
Accumulation Zones Can Reveal Institutional Activity

Source: barchart.com
Large investors rarely buy everything at once. That would push prices up too quickly. Instead, they accumulate shares slowly. This behaviour sometimes shows up on charts. Certain signs may appear:
- price moves sideways for weeks
- The volume slowly increases
- small upward pushes appear
These periods are sometimes called accumulation zones. Experienced investors watch them closely. Because they may indicate that institutions are quietly building positions.
Why Charts Reflect Market Psychology
At the end of the day, stock charts represent human decisions. People buy when they feel confident. They sell when they feel nervous. Fear and optimism constantly shape the market. Charts capture those emotions visually. Institutional investors know this. That is why they spend hours studying price behaviour. They are not just looking at numbers. They are trying to understand market psychology. And often, the patterns repeat.
Conclusion
Stock market graphs may look simple at first. Just lines moving up and down. But institutional investors see much more than that. They study trends, volume, support levels, and resistance zones carefully. These signals help them understand where money is moving in the market. Once you begin noticing these patterns yourself, charts start telling a much clearer story.